
Apache Spark has totally changed the landscape of big data processing, enabling us to tackle massive datasets with the power of distributed computing. But, as our Spark applications grow in size and complexity, the need for effective performance tuning becomes crucial. To maximize your resources, accelerate job completion, and minimize costs, it’s essential to optimize your Spark jobs. In big Spark clusters, poorly optimized jobs can lead to sluggish execution times, resource bottlenecks, and even job failures. Luckily, Apache Spark performance tuning lets you boost performance while avoiding these drawbacks. Spark offers a bunch of features and tactics that, when used appropriately, can significantly improve performance.
In this article, we will cover the challenges faced during Spark performance tuning and provide 7 best essential techniques to optimize your Spark applications.
Apache Spark Architecture Overview
Let's start with the basics. To get a thorough understanding of Apache Spark's performance tuning, we need to pop the hood and see how Spark works behind the scenes. Here is the breakdown of Apache Spark architecture.
Apache Spark architecture operates on a master-worker model and is built around several key components and abstractions that enable high-speed data processing, fault tolerance, and real-time analytics.
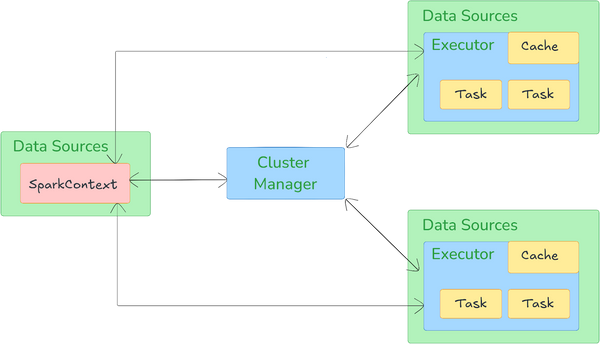
Apache Spark architecture relies on two main abstractions:
Let’s break down the key components of Apache Spark Architecture:
1) Driver Manager
Driver program is the main control unit that orchestrates the execution of a Spark application. It converts the application code into a directed acyclic graph (DAG) of tasks, and submits tasks to the cluster’s executors. It also handles scheduling and monitors the overall progress of the job.
2) Cluster Manager
Cluster Manager handles resource allocation across applications. Spark supports various cluster managers, including:
- Standalone mode: Spark’s built-in manager.
- Apache Mesos and Hadoop YARN: External cluster managers that integrate with Spark to manage resources.
- Kubernetes: A container orchestration platform that can manage Spark clusters.
3) Executors
Executors run tasks and store data locally in memory. They are launched on each worker node and communicate with the driver to fetch tasks, execute them, and report the results.
4) Worker Nodes
Worker Nodes are the machines in a cluster that execute the tasks assigned by the driver. Each worker node runs one or more executors, which perform the actual task execution and hold data in memory or disk.
Check out this article on how Apache Spark works to learn more in-depth about Apache Spark architecture.
Apache Spark architecture is designed for parallel and distributed data processing, making it efficient for handling large-scale workloads like real-time data streaming, batch processing, and machine learning pipelines.
Save up to 50% on your Databricks spend in a few minutes!


Now that we have a foundational understanding of Apache Spark architecture, let's explore 7 key techniques for Apache Spark performance tuning.
7 Essential Techniques for Apache Spark Performance Tuning
1) Use DataFrames/Datasets over RDDs
Picking the right abstraction is crucial for Spark performance optimization. When Spark first came out, it relied on RDDs (Resilient Distributed Datasets) as its core API, but for most modern workloads, DataFrames and Datasets are now preferred due to their integration with Spark’s internal optimization engine—Catalyst—and execution engine—Tungsten.
The Catalyst Optimizer plays a key role in optimizing DataFrame and Dataset operations by transforming them into highly efficient execution plans. Here's a simplified outline of how it works:
- It converts your high-level DataFrame/Dataset operations into a logical plan.
- Optimization rules, such as predicate pushdown, constant folding, and projection pruning are applied to the logical plan.
- The optimizer generates multiple physical plans, estimates their execution costs, and selects the most efficient one.
- Finally, it then generates optimized Java bytecode for distributed execution.
This process often results in significantly faster execution compared to manually optimized RDD operations.
DataFrames vs Datasets vs RDDs
DataFrames are distributed collections of data organized into named columns. You can think of them as equivalent to a table in a relational database or a data frame in R/Python. They offer richer optimization capabilities compared to RDDs.
Datasets, on the other hand, are a strongly typed version of DataFrames. They provide a type-safe, object-oriented programming interface. In Scala, DataFrame is actually a type alias for Dataset[Row].
DataFrames and Datasets offer several advantages over RDDs:
- DataFrames and Datasets leverage Spark SQL's Catalyst Optimizer for automatic query optimization.
- DataFrames and Datasets utilize Tungsten’s efficient off-heap memory management and code generation.
- DataFrames and Datasets provide a higher-level API for expressing complex transformations.
- Both DataFrames and Datasets offer improved performance through an optimized internal data format and reduced serialization overhead.
When to Use RDDs?
Apache Spark RDDs are useful in the following scenarios:
- When you need fine-grained control over dataset transformations and actions.
- For unstructured data (e.g., media or text streams).
- When you prefer functional programming constructs.
- When schema enforcement isn't necessary, allowing for more flexible data handling.
- If you can accept performance trade-offs in exchange for lower-level control.
When to Use DataFrames or Datasets?
Choose DataFrames or Datasets in these situations:
- When you need rich semantics, high-level abstractions, and domain-specific APIs.
- For tasks requiring high-level expressions, filters, maps, aggregations, averages, sums, SQL queries, and columnar access. Lambda functions on semi-structured data are also well-supported.
- Language-Specific Recommendations:
- R Users: If you are a R user, use DataFrames.
- Python Users: If you are a Python user, use DataFrames, but revert to RDDs if you need more control over your data.
- Opt for Datasets if you want type safety at compile time, typed JVM objects, and the benefits of Catalyst optimization and Tungsten's efficient code generation.
- Use DataFrames or Datasets for a unified and simplified API across Spark libraries.
To make the most of DataFrames and Datasets:
1) Use Schema: Always define your schema explicitly when possible. This allows Spark to skip the schema inference step and can significantly speed up your job.
from pyspark.sql.types import StructType, StructField, StringType, IntegerType

schema = StructType([
    StructField("name", StringType(), True),
    StructField("age", IntegerType(), True)
])

df = spark.read.schema(schema).csv("path/to/file.csv")
Apache Spark Performance Tuning
2) Use SQL Functions: Make use of built-in SQL functions whenever feasible, as they are optimized and can benefit from whole-stage code generation.
from pyspark.sql.functions import col, sum

df = df.groupBy("department").agg(sum(col("salary")).alias("total_salary"))
Apache Spark Performance Tuning
3) Avoid Unnecessary Conversions: Try to stay within the DataFrame API/Dataset API as much as possible. Each conversion to and from RDDs can incur a performance penalty.
4) Always Use Appropriate Data Types: Select the most appropriate and compact data types for your columns to optimize memory usage and processing speed.
2) Optimize Data Partitioning
Proper data partitioning is crucial for achieving optimal performance in Spark. Partitions are the fundamental units of parallelism in Spark—each partition is processed by a separate task in an executor thread. The effectiveness of partitioning directly impacts the parallelism, load balancing, and resource utilization of Spark jobs.
The primary goal of partitioning is to distribute data evenly across your cluster. Whenever data is evenly distributed:
- Each executor handles a similar amount of work, maximizing parallel processing and resource utilization.
- Data skew is minimized, preventing bottlenecks where some executors are overloaded while others are underutilized.
- Reduces the overhead associated with shuffling data during operations (which we'll discuss in the next section) that require data movement across partitions.
Using coalesce() and repartition()
Spark provides two main methods for adjusting the number of partitions:
1) coalesce(numPartitions):
Use coalesce() to reduce the number of partitions, typically when shrinking datasets after a transformation. It minimizes data movement by avoiding a full shuffle, making it more efficient in scenarios where reducing partitions is needed.
# Reduce to 10 partitions
df_reduced = df.coalesce(10)
Apache Spark Performance Tuning
2) repartition(numPartitions):
repartition() performs a full shuffle to either increase or decrease the number of partitions. Although this can be expensive, it ensures that data is evenly spread across partitions, which is essential for balanced workload distribution.
# Increase to 100 partitions
df_increased = df.repartition(100)
Apache Spark Performance Tuning
You can also repartition by specific columns, which is particularly useful for joins or aggregations that benefit from co-locating related data in the same partition:
# Repartition by date column into 50 partitions
df_date_partitioned = df.repartition(50, "date")
Apache Spark Performance Tuning
Choosing the Right Number of Partitions
The ideal number of partitions depends on your cluster resources and the size of your data. Here are some guidelines:
- Start with 2-3 tasks per CPU core in your cluster. For example, if your cluster has 10 nodes, each with 4 cores, aim for 80-120 partitions.
- Each partition should ideally be 100-200MB in size. You can estimate the number of partitions by dividing the total data size by this target partition size.
- For operations involving wide transformations (e.g., groupBy, join), you might benefit from smaller partitions to distribute the workload more evenly.
Partitioning Strategies for Different Data Formats in Apache Spark
Different file formats in Spark benefit from distinct partitioning strategies:
1) Parquet
Parquet Files: Parquet is a columnar format with built-in partitioning support. Spark aligns its partitions with those of the Parquet files, optimizing reads by minimizing data shuffling during narrow transformations.
2) CSV/JSON
CSV and JSON Files: These file formats do not support internal partitioning. Thus, repartitioning is often required after reading them, especially when the number of files is not aligned with the desired level of parallelism.
3) ORC
ORC Files: Similar to Parquet, ORC is a columnar format with internal partitioning support. Spark leverages ORC’s partitions for efficient reads, minimizing the need for additional repartitioning.
Monitoring Partition Size
You can check the size and number of partitions using the following:
Checking the Number of partitions:
num_partitions = df.rdd.getNumPartitions()
print(f"Number of partitions: {num_partitions}")
Apache Spark Performance Tuning
Checking the size of each partition:
partition_sizes = df.rdd.mapPartitions(lambda x: [sum(1 for _ in x)]).collect()
print("Size of each partition:")
for i, size in enumerate(partition_sizes):
    print(f"Partition {i}: {size}")
Apache Spark Performance Tuning
Note: Always have evenly sized partitions that are neither too small (causing task scheduling overhead) nor too large (causing memory pressure).
Best Practices
- Avoid Too Many Small Partitions: Small partitions result in overhead due to excessive task scheduling and increased garbage collection.
- Avoid Too Few Large Partitions: Large partitions can cause memory pressure, leading to out-of-memory errors.
- Monitor Shuffle Operations: Always make sure that your partitioning strategy minimizes expensive shuffle operations, which can severely impact performance.
3) Minimize Shuffle Operations
Shuffle operations are one of the most expensive steps in Spark processing. They involve redistributing data across partitions, often requiring data to be moved between executors or even machines. This can be extremely resource-intensive, consuming both network bandwidth and disk I/O—potentially becoming a major bottleneck in your Spark application.
Shuffles occur when data needs to be redistributed across the cluster. Common operations that trigger shuffles include:
- Repartition and coalesce
- Join operations (unless the RDDs are co-partitioned)
- GroupByKey and reduceByKey
- Aggregations like groupBy and agg
- Sort operations like sortBy and orderBy
While shuffles are sometimes necessary, minimizing them can greatly improve performance.
Techniques to Reduce Shuffling
Here are several strategies to minimize shuffling in Apache Spark:
1) Early Filtering
One of the most effective ways to reduce shuffling is to filter out unnecessary data as early as possible in your data pipeline. Reducing the dataset size before performing expensive operations helps minimize the amount of data that needs to be shuffled.
Inefficient Example (Late Filtering):
df_bad = df.groupBy("department").agg(F.avg("salary").alias("avg_salary")).filter(F.col("department") != "IT")Apache Spark Performance Tuning
In this example, the entire dataset is shuffled before filtering, leading to unnecessary data transfer across nodes.
Efficient Example (Early Filtering):
df_good = df.filter(F.col("department") != "IT").groupBy("department").agg(F.avg("salary").alias("avg_salary"))Apache Spark Performance Tuning
Here, the filter is applied first, reducing the data size before the grouping operation, leading to a more efficient shuffle.
2) Using reduceByKey Instead of groupByKey
When working with key-value RDDs, reduceByKey performs much better than groupByKey for many use cases. reduceByKey combines records with the same key on each partition before shuffling the data, significantly reducing the amount of data transferred over the network.
Inefficient Example (groupByKey):
rdd.groupByKey().mapValues(sum)Apache Spark Performance Tuning
This operation shuffles all the values across partitions before performing any aggregation, causing a large data transfer.
Efficient Example (reduceByKey):
rdd.reduceByKey(lambda x, y: x + y)Apache Spark Performance Tuning
This approach performs aggregation within each partition before shuffling, reducing the shuffle volume.
3) Broadcast Joins
For joins where one DataFrame is significantly smaller than the other, use a broadcast join. This replicates the smaller DataFrame to all executor nodes, eliminating the need for shuffling.
from pyspark.sql.functions import broadcast

# Assuming small_df is small enough to be broadcasted
result = large_df.join(broadcast(small_df), "joinKey")
Apache Spark Performance Tuning
Broadcast joins work best when the smaller DataFrame can fit in memory on each executor.
4) Repartitioning Strategically
Sometimes, repartitioning your data before a shuffle operation can improve performance, especially if it reduces data skew.
Repartition by join key before a join operation
df1 = df1.repartition("joinKey")
df2 = df2.repartition("joinKey")
result = df1.join(df2, "joinKey")
Apache Spark Performance Tuning
5) Using Map-Side Reductions
Map-side reductions can help reduce the amount of data shuffled by performing partial aggregations before the shuffle occurs. Using operations like combineByKey or aggregateByKey, you can perform custom aggregation logic that reduces data on each node before shuffling it across the network.
def create_combiner(value):
    return (value, 1)

def merge_value(acc, value):
    return (acc[0] + value, acc[1] + 1)

def merge_combiners(acc1, acc2):
    return (acc1[0] + acc2[0], acc1[1] + acc2[1])

average = rdd.combineByKey(
    create_combiner,
    merge_value,
    merge_combiners
).mapValues(lambda x: x[0] / x[1])
Apache Spark Performance Tuning
Tuning Shuffle Partitions
The default number of shuffle partitions in Spark is 200, but this may not be optimal for every workload. The number of shuffle partitions can significantly impact performance—too few partitions can overload some executors, while too many small partitions can cause excessive task scheduling overhead.
You can tune the number of partitions using the spark.sql.shuffle.partitions configuration:
spark.conf.set("spark.sql.shuffle.partitions", "500")Apache Spark Performance Tuning
A good rule of thumb is to aim for partition sizes between 100MB and 200MB. You can calculate the number of partitions by dividing the total dataset size by your target partition size.
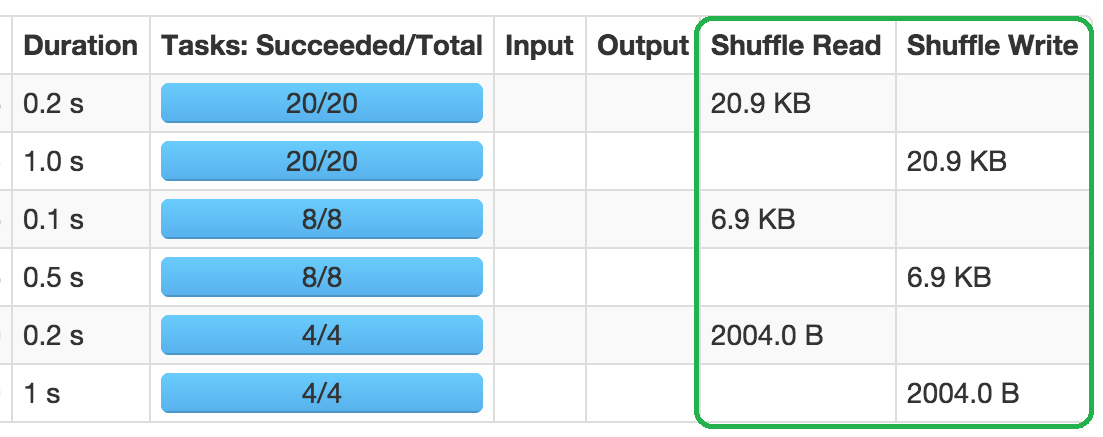
Monitoring Shuffle Operations
The Spark UI is an excellent tool for identifying and analyzing shuffle operations. Look for the "Shuffle Read" and "Shuffle Write" metrics in the "Stage" tab. Large values here indicate that your job is doing a lot of shuffling, which might be an opportunity for optimization.
Sometimes, you can't avoid shuffling data. But, reducing it or running it efficiently can greatly improve your Spark job performance. Check the causes of the shuffles. Fix them by filtering early, broadcasting small tables, and using map-side reductions to optimize your workflow.
4) Utilize Built-in Functions Over User-Defined Functions (UDFs)
User-defined functions (UDFs) in Apache Spark offer great flexibility for custom operations, but they come with a significant performance cost. Understanding when to use built-in functions and how to optimize User-defined Functions (UDFs) when they're necessary is crucial for maintaining high performance in your Spark applications.
User-defined Functions (UDFs) can slow down your Spark jobs for several reasons:
- Spark must serialize data, pass it to the UDF, and then deserialize the result. This extra computation and I/O adds latency to the job.
- The Catalyst optimizer in Spark cannot analyze or optimize UDFs. As a result, performance improvements like predicate pushdown or execution plan optimizations that normally benefit built-in functions are missed.
- User-defined Functions (UDFs) typically process one row at a time, making them slower compared to built-in functions, which can leverage vectorized operations on entire columns.
Spark's built-in functions, available in pyspark.sql.functions, offer several advantages:
- Built-in functions are fully optimized by the Catalyst optimizer.
- Many built-in functions can operate on entire columns at once, rather than processing row-by-row, which enhances performance.
- Built-in functions often result in simpler, more readable, and maintainable code
Here’s an example comparing a UDF to a built-in function:
from pyspark.sql.functions import udf, col, upper

# Using a UDF
upper_udf = udf(lambda x: x.upper())
df_udf = df.withColumn("upper_name", upper_udf(col("name")))

# Using a built-in function
df_builtin = df.withColumn("upper_name", upper(col("name")))
Apache Spark Performance Tuning
The built-in upper() function will generally perform much better than the UDF equivalent.
When User-defined Functions (UDFs) are Necessary
Despite their drawbacks, there are scenarios where User-defined Functions (UDFs) may be necessary:
- When your operation is too complex to express using built-in functions.
- When you need to use external Python libraries that aren't available in Spark.
- When you have existing Python functions that you want to reuse in Spark.
Optimizing UDF Performance
If you must use UDFs, there are strategies to mitigate their performance impact:
1) Use Pandas User-defined Functions (UDFs) (a.k.a. Vectorized UDFs)
Pandas UDFs (also known as vectorized UDFs), introduced in Spark 2.3, provide a more efficient alternative to standard UDFs. Pandas UDFs operate on batches of rows instead of one row at a time, allowing for vectorized execution, which is significantly faster.
from pyspark.sql.functions import pandas_udf
from pyspark.sql.types import StringType

@pandas_udf(StringType())
def upper_pandas(s):
    return s.str.upper()

df_pandas_udf = df.withColumn("upper_name", upper_pandas(col("name")))
Apache Spark Performance Tuning
2) Use SQL User-defined Functions (UDFs) for Simple Operations
If your UDF logic is simple, consider using SQL UDFs. SQL UDFs are typically more performant than Python UDFs because they operate directly within the JVM (Java Virtual Machine), avoiding the overhead associated with Python UDFs.
spark.udf.register("upper_sql", lambda x: x.upper())
df_sql_udf = spark.sql("SELECT *, upper_sql(name) as upper_name FROM my_table")
Apache Spark Performance Tuning
3) Use Broadcast Variables for Lookup Tables
If your UDF relies on a lookup table, using broadcast variables can significantly reduce data transfer overhead. Broadcasting the lookup table distributes it to all executors, eliminating the need to shuffle data.
lookup_table = {"a": 1, "b": 2, "c": 3}
broadcast_lookup = spark.sparkContext.broadcast(lookup_table)

@udf("integer")
def lookup_udf(key):
    return broadcast_lookup.value.get(key, 0)

df_result = df.withColumn("looked_up", lookup_udf(col("key")))
Apache Spark Performance Tuning
4) Minimize User-defined Function (UDF) Calls
Reduce the number of UDF invocations by structuring your code to apply UDFs only once when necessary. Instead of calling a UDF in both filter and select operations, for example, try to combine them.
Best Practices
- Always Check for Built-in Alternatives: Before writing a UDF, always check the pyspark.sql.functions module for a built-in function that could accomplish the same task.
- Combine Operations: When possible, combine multiple operations into a single UDF to reduce the number of UDF calls.
- Use Strong Typing: Specify the return type of your UDF. This helps Spark optimize the execution plan.
- Profile Your UDFs: Use the Spark UI to identify which UDFs are taking the most time and focus on optimizing those.
- Consider Using Scala UDFs: For performance-critical operations, consider implementing your UDF in Scala, which can be significantly faster than Python UDFs.
So by using built-in functions and optimizing your use of UDFs, you can significantly improve the performance of your Spark applications. Remember, every optimization counts when dealing with big data processing.
5) Implement Effective Caching and Persistence
Caching and persistence are crucial optimization techniques in Apache Spark, especially when dealing with iterative algorithms or repeated access to datasets. By caching or persisting datasets in memory or on disk, Spark can avoid recomputing them each time they're needed—this can lead to substantial performance improvements in your Spark applications.
In Spark, caching and persistence are mechanisms to store the intermediate results of computations. The main difference is:
- Caching is a shorthand for storing the data using the default storage level (usually MEMORY_ONLY).
- Persistence allows you to specify the storage level, giving you more control over how the data is stored.
Benefits of Caching and Persistence
- Accessing data from memory is much faster than recomputing it or reading from disk.
- Persisting intermediate results lowers CPU usage and saves cluster resources.
- Persisted RDDs can be automatically reconstructed in case of node failures.
When to Use Caching and Persistence
Caching and persistence are beneficial when:
- The dataset will be accessed multiple times across different stages of a job.
- Recomputing the dataset is expensive (e.g., due to shuffling, complex transformations, or wide dependencies).
- The dataset fits comfortably into memory or disk space, depending on your persistence level.
Different Persistence Levels
Spark offers several storage levels for persisting data:
1) MEMORY_ONLY
Stores the RDD as deserialized Java objects in the JVM. If the RDD doesn't fit in memory, some partitions will not be cached and will be recomputed on the fly each time they're needed.
2) MEMORY_AND_DISK
Store RDD as deserialized Java objects in the JVM. If the RDD doesn't fit in memory, store the partitions that don't fit on disk, and read them from there when they're needed.
3) MEMORY_ONLY_SER
Store RDD as serialized Java objects (one byte array per partition). This is generally more space-efficient than deserialized objects, especially when using a fast serializer, but more CPU-intensive to read.
4) MEMORY_AND_DISK_SER
Similar to MEMORY_ONLY_SER, but spills partitions that don't fit in memory to disk. Provides a balance between memory usage, CPU efficiency, and disk access
5) DISK_ONLY
Stores RDD partitions only on disk. Provides the lowest memory usage but requires reading from disk every time
6) MEMORY_ONLY_2, MEMORY_AND_DISK_2
Same as MEMORY_ONLY and MEMORY_AND_DISK, but replicate each partition on two cluster nodes. It provides extra fault tolerance by recomputing lost data on a different node
7) OFF_HEAP (experimental)
Stores data in serialized form in Off-Heap memory and provides a balance between MEMORY_ONLY_SER and DISK_ONLY
Choosing the appropriate storage level depends on your use case:
- Use MEMORY_ONLY for fast in-memory processing when your dataset fits entirely in memory.
- Use MEMORY_AND_DISK for a balance between memory and disk usage when your dataset exceeds memory capacity.
- Use MEMORY_ONLY_SER or MEMORY_AND_DISK_SER for space-efficient storage when dealing with larger datasets.
How to Cache and Persist Data
For caching:
df.cache()
# or
df.persist()
Apache Spark Performance Tuning
For persistence with a specific storage level:
from pyspark import StorageLevel

df.persist(StorageLevel.MEMORY_AND_DISK)
Apache Spark Performance Tuning
It’s important to trigger an action (such as df.count()) after caching to materialize the cache and ensure that Spark physically stores the data.
Best Practices for Caching and Persistence
- Only cache datasets that you'll reuse multiple times. Caching unnecessarily can waste memory and might even slow down your application.
- Use the Spark UI to monitor how much memory is being used by cached data. If you're running out of memory, consider uncaching datasets or using a different storage level.
- When you're done with a cached dataset, call unpersist() to free up resources:
df.unpersist()Apache Spark Performance Tuning
- If your dataset is small, MEMORY_ONLY is usually the best option. For larger datasets, consider using MEMORY_AND_DISK or MEMORY_ONLY_SER.
- Cache the dataset after you've applied the transformations that you'll use repeatedly, but before the point where the data is used multiple times.
Caching in Spark SQL
In Spark SQL, caching is equally important when working with frequently accessed tables:
spark.sql("CACHE TABLE my_table")Apache Spark Performance Tuning
Or for DataFrames:
df.createOrReplaceTempView("my_table")
spark.sql("CACHE TABLE my_table")
Apache Spark Performance Tuning
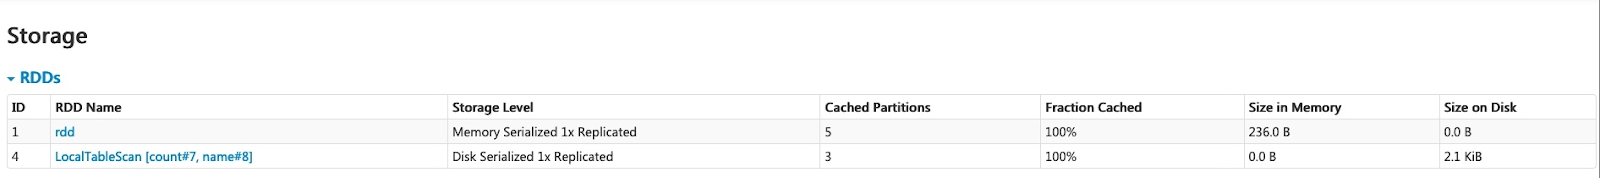
Monitoring Cached Data with Spark UI
Apache Spark UI gives you a complete rundown on cached data.
Check the "Storage" tab to see which RDDs are cached, how big they are, and what percentage is stored in memory or on disk.
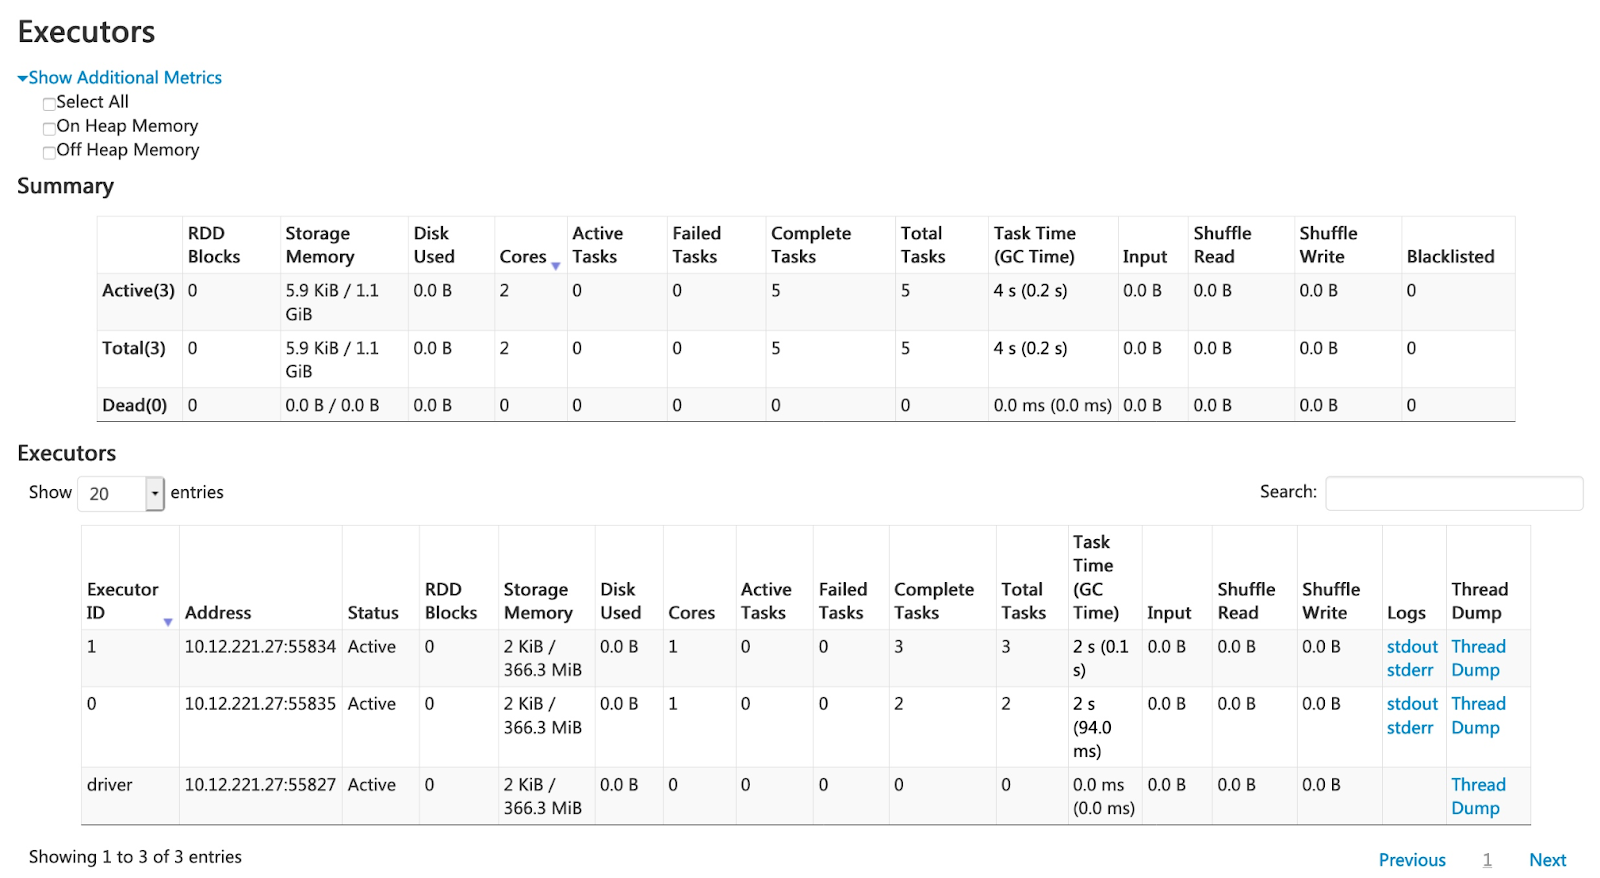
The "Executors" tab shows how much memory each executor uses for caching.
Cut your Spark job computation time and improve performance by using smart caching and persistence by using the strategies that we provided above. Just keep in mind that caching isn't a magic fix—it should be applied strategically to avoid memory exhaustion or inefficient resource utilization.
Now in the next section, we'll see how to leverage Adaptive Query Execution (AQE) to further optimize your Spark applications.
6) Leverage Adaptive Query Execution (AQE)
Adaptive Query Execution (AQE) is one of the major features introduced in Spark 3.0, designed to dynamically optimize query execution plans based on runtime statistics. By making runtime adjustments, AQE can significantly enhance the performance of complex queries, reduce data skew, and minimize resource usage—all with minimal manual intervention from developers.
How Adaptive Query Execution Works?
Unlike traditional static query plans, AQE enables Spark to adjust query plans during execution. It collects runtime statistics (like data sizes, skew, and partitioning information) and uses these insights to optimize the query. This adaptive optimization leads to improved performance in scenarios where the data distribution isn't known beforehand or when dealing with complex transformations and joins.
Here are some key features of Adaptive Query Execution (AQE)
- Adaptive Query Execution can adjust the join strategy at runtime based on the actual size of the datasets involved. For instance, if a table turns out to be small enough during execution, AQE can switch from a sort-merge join to a more efficient broadcast join, reducing shuffle overhead.
- Adaptive Query Execution can dynamically coalesce partitions (combine small partitions into reasonably sized partitions) after shuffle exchange. Very small tasks have worse I/O throughput and tend to suffer more from scheduling overhead and task setup overhead. Combining small tasks saves resources and improves cluster throughput.
- Adaptive Query Execution can dynamically handle skew in sort-merge join and shuffle hash join by splitting (and replicating if needed) skewed tasks into roughly evenly sized tasks.
- Adaptive Query Execution can dynamically detect and propagate empty relations.
How to enable and configure AQE?
Adaptive Query Execution is enabled by default in Spark 3.0 and later. You can verify or change its status using:
# Verify AQE status
spark.conf.get("spark.sql.adaptive.enabled")

# Enable AQE if not already enabled
spark.conf.set("spark.sql.adaptive.enabled", "true")
Apache Spark Performance Tuning
On top of enabling AQE, several important configuration settings allow further optimization:
1) Broadcast Join Threshold: Specifies the maximum size of a table to be broadcasted for a join. AQE adjusts the join strategy based on this value.
spark.conf.set("spark.sql.autoBroadcastJoinThreshold", "10m")Apache Spark Performance Tuning
2) Post-Shuffle Partition Coalescing: Controls whether Spark should combine small partitions after a shuffle.
spark.conf.set("spark.sql.adaptive.coalescePartitions.enabled", "true")Apache Spark Performance Tuning
3) Advisory Partition Size: Sets the target size (in bytes) for shuffle partitions after coalescing. Adjusting this can help balance between I/O performance and parallelism.
spark.conf.set("spark.sql.adaptive.advisoryPartitionSizeInBytes", "64m")Apache Spark Performance Tuning
4) Skew Join Optimization: Enables AQE to handle data skew during joins by splitting large skewed partitions.
spark.conf.set("spark.sql.adaptive.skewJoin.enabled", "true")Apache Spark Performance Tuning
… and so much more!
Best Practices for Using AQE
1) Monitor Query Plans: To understand how AQE is optimizing your queries, use explain() with the mode="extended" parameter. This will provide insights into the runtime query plan changes made by AQE.
df.explain(mode="extended")Apache Spark Performance Tuning
2) Adjust Thresholds: Experiment with different threshold values to find the optimal settings for your workload, especially:
- spark.sql.autoBroadcastJoinThreshold
- spark.sql.adaptive.advisoryPartitionSizeInBytes
3) Use with Other Optimizations: Adaptive Query Execution works well in conjunction with other optimization techniques we've discussed, like proper data partitioning and caching.
4) Be Very Cautious of Limitations: Adaptive Query Execution primarily optimizes SQL-based operations and DataFrame APIs. It may not apply to all types of Spark jobs, particularly those using RDDs directly.
Limitations of Using AQE
Keep in mind that Adaptive Query Execution has its downsides.
- Adaptive Query Execution introduces some overhead due to the collection and analysis of runtime statistics. For super-short-running queries, this overhead might outweigh the benefits.
- Adaptive Query Execution makes decisions on the fly, so query execution can be pretty unpredictable from one run to the next. That's a problem if you need absolute consistency.
- Running multiple jobs simultaneously may lead AQE to adjust resource allocation mid-query, potentially affecting the performance of other jobs.
7) Optimize Joins with Broadcast Variables
Join operations are among the most resource-intensive tasks in Spark, often leading to significant shuffle operations—especially with large datasets. To mitigate this, one of the most effective optimization techniques is the use of broadcast joins. Broadcast joins minimize shuffle operations and improve performance by broadcasting the smaller dataset to all the nodes in the cluster, allowing each executor to perform the join locally.
How Broadcast Joins Work?
In a broadcast join, Spark broadcasts the smaller dataset to every executor node. This allows the larger dataset to remain partitioned across the cluster while each executor performs the join locally with the broadcasted dataset—effectively eliminating the need for shuffling the larger dataset. The elimination of shuffles is crucial because shuffle operations are both expensive and slow, requiring heavy disk I/O and network communication between nodes.
When to Use Broadcast Joins
Broadcast joins are most effective when:
- Broadcast joins are typically used when one dataset is small enough to fit in the memory of each executor node. While the threshold varies depending on cluster configuration, datasets of up to a few hundred megabytes are generally considered appropriate for broadcasting.
- Broadcast joins work best for equi-joins, where the join is performed based on equality conditions (ON a.col = b.col). They are not well-suited for complex join conditions, such as range-based joins.
If the smaller dataset exceeds the available memory on an executor, Spark can throw out-of-memory (OOM) errors, leading to job failures. This is one of the key risks to keep in mind when using broadcast joins.
Using Broadcast Hints
Although Spark can automatically choose to use a broadcast join based on dataset size and statistics, you can explicitly control broadcast behavior using hints:
from pyspark.sql.functions import broadcast

result = large_df.join(broadcast(small_df), "join_key")
Apache Spark Performance Tuning
Automatic Broadcast Join Optimization
Spark uses the spark.sql.autoBroadcastJoinThreshold configuration to determine the maximum size of a table that will be automatically broadcast. In Spark 3.0 and later, the default is 10MB. You can adjust this:
spark.conf.set("spark.sql.autoBroadcastJoinThreshold", "100m")Apache Spark Performance Tuning
Best Practices for Broadcast Joins
- Always keep an eye on the sizes of your datasets. If the smaller dataset grows over time, a broadcast join might become less efficient or even fail.
- Broadcast joins can be a huge performance booster, but using them too much can put a lot of memory pressure . So, use them only when you really need to.
- If possible, filter the dataset you're going to broadcast before the join. This can reduce the amount of data that needs to be broadcast.
filtered_small_df = small_df.filter(small_df.some_column > 100)
result = large_df.join(broadcast(filtered_small_df), "join_key")
Apache Spark Performance Tuning
- If broadcast joins aren't suitable (e.g., both datasets are large), consider partitioning both datasets on the join key before joining.
- Verify that your broadcast hint is applied using result.explain().
Limitations of Broadcast Joins
- Memory Limitations: The broadcasted dataset must fit within the memory of each executor. If the dataset is too large, Spark can encounter out-of-memory (OOM) errors, resulting in job failures.
- Broadcast Overhead: Broadcasting a dataset incurs both time and network resources. For very small datasets or very selective joins, the overhead might outweigh the benefits.
- Repeated Broadcasts: If the same dataset is broadcast multiple times in a job, consider caching it after the first broadcast.
Advanced Techniques
- Broadcast Hash Joins: Apache Spark uses a hash table for broadcast joins, which is efficient for equality joins. But, it's less efficient for range joins or other complex join conditions.
- Bloom Filter Joins: For scenarios where broadcasting isn't feasible, Spark may employ Bloom filters to reduce shuffled rows during joins. This technique filters out non-matching rows early, improving join efficiency.
Use broadcast hints and other tricks to get the most out of your joins. This will cut down on the amount of data shuffled across your cluster, leading to faster query execution times and more efficient resource utilization.
Bonus Tip—Monitoring and Configuration Tuning
Now that you've learned 7 best techniques to seriously boost Spark's speed. Now, you need a solid plan for monitoring and configuration tuning strategy. This way, you can spot slow spots, see how resources are used, and get your Spark apps running as smoothly as possible.
First—Utilizing Spark UI for Performance Monitoring
Spark UI is an essential tool for monitoring and diagnosing Spark applications in real-time. It provides detailed insights into job execution, resource usage, and performance metrics. Here are key tabs and metrics to focus on:
1) Jobs Tab: Provides an overview of all jobs, their status, and duration. Look for long-running jobs or those that failed.
2) Stages Tab: Shows details about each stage within a job. Pay attention to the "Shuffle Read" and "Shuffle Write" metrics, as large shuffles can cause significant performance bottlenecks. Optimize or repartition data if heavy shuffling is observed.
3) Storage Tab: Displays the persisted RDDs and DataFrames, if any, in the application. Excessive persistence can lead to memory pressure. Evaluate whether any cached data can be unpersisted or re-persisted with a different storage level.
4) Environment Tab: Shows the values for the different environment and configuration variables, including JVM, Spark, and system properties. Keep track of these settings to make sure they align with the optimal configuration for your workloads.
5) Executors Tab: Provides detailed information about executor resource usage, including memory, CPU, and garbage collection (GC) time. High GC time can slow down applications—indicating a need for better memory tuning or repartitioning.
6) SQL Tab: Displays physical query execution plans for Spark SQL queries. The Query Plan offers insights into operations like joins, filters, and aggregations. Look for signs of inefficiency, such as unnecessary shuffles or suboptimal join strategies.
7) Structured Streaming Tab (for streaming jobs): Provides stats like processing times and input rates for structured streaming queries. These metrics help identify potential performance bottlenecks in streaming workloads.
8) Streaming (DStreams) Tab: Displays scheduling delay and processing time for each micro-batch in the data stream, which can be useful for troubleshooting the streaming application.
9) JDBC/ODBC Server Tab: Displays general information about the JDBC/ODBC server: start time and uptime.
Here are some key metrics to watch for:
- Executor Memory Usage: High memory usage might indicate a need for more executors or better data partitioning.
- Garbage Collection Time: Excessive GC time can significantly slow down your application. Reducing memory pressure through better partitioning or tuning the spark.executor.memory and spark.executor.cores parameters can alleviate this issue.
- Shuffle Read + Shuffle Write: Large shuffle operations are often performance bottlenecks. Optimizing data repartitioning before shuffles or using techniques like broadcast joins can minimize this issue.
- Task Skew: Look for tasks that take significantly longer than others in the same stage. Addressing skew through techniques like salting or enabling Adaptive Query Execution (AQE) can help.
- Data Spill: Data spilled to disk indicates that you might need more memory or better partitioning. Monitor this carefully as disk I/O is much slower than memory-based operations.
Here are some key important configurations to tune:
1) Executor Memory: spark.executor.memory
- Set this based on your workload size. Make sure that each executor has enough memory to hold partitions without spilling to disk.
2) Executor Cores: spark.executor.cores
- Balance this with the number of executors to fully utilize your cluster resources. Overloading executors with too many cores can result in suboptimal performance due to context switching.
3) Dynamic Resource Allocation: spark.dynamicAllocation.enabled
- Enables Spark to dynamically adjust the number of executors based on workload.
4) Shuffle Partitions: spark.sql.shuffle.partitions
- The default number of shuffle partitions (200) is often too high or too low for specific workloads. Adjust this based on your data size. Too many partitions increase overhead, while too few can cause large partitions and memory bottlenecks.
5) Broadcast Threshold: spark.sql.autoBroadcastJoinThreshold
- Set this value based on your cluster's memory capacity. Increasing it can boost performance for moderately sized joins, but overdoing it may lead to memory issues.
Second—Tools for Configuration Optimization
You've got a bunch of tools to help you monitor your Spark cluster and make it run better. One is the Spark Configuration Optimization Calculator. It is an online calculator that helps to fine-tune the overall Spark configurations. And then there's Chaos Genius. It's a powerful Observability tool. It shows you what's happening in your Apache Spark cluster. It also suggests the best configurations, so you don't have to do it yourself.
Want to take Chaos Genius for a spin?
It takes less than 5 minutes.

Best Practices for Monitoring and Tuning
- Start by setting a baseline for how your typical jobs run, so you can catch any dips in performance.
- When making changes to your setup, do it a little at a time and see what impact it has.
- Keep in mind that what works best might be different depending on whether you're in a dev, testing, or production environment.
- Regularly check your Spark configs and job performance, especially after making big changes to your data or how it's processed.
- Keep a log of any changes you make and how they affect your setup, so you can use that info to make future adjustments.
That's it! So, to keep your Spark apps running smoothly, you need to put a solid monitoring and tuning plan in place. This way, you can adapt to changing data and processing needs.
Further Reading
- Apache Spark Performance Tuning
- Spark Tuning: Optimize Apache Spark
- Apache Spark Core – Practical Optimization Daniel Tomes (Databricks)
- SPARK CONFIGURATION OPTIMIZATION
- PySpark - Zero to Hero | PySpark Tutorial 2024
- Apache Spark Architecture 101: How Spark Works
- Apache Spark vs Flink—A Detailed Technical Comparison
- Strategies for tuning Spark job performance
Conclusion
And that’s a wrap! Optimizing Apache Spark performance is both an art and a science. It requires a deep understanding of Spark's internals, careful analysis of your specific use case, and often, a fair amount of experimentation. If you read this guide from start to finish, you'll likely get a good grip on how to boost your Apache Spark performance.
In this article, we have covered:
- Apache Spark Architecture Overview
- 7 Essential Techniques for Apache Spark Performance Tuning
- Leveraging DataFrames and Datasets over RDDs
- Optimizing data partitioning
- Minimizing shuffle operations
- Utilizing built-in functions over UDFs
- Implementing effective caching and persistence
- Leveraging Adaptive Query Execution (AQE)
- Optimizing joins with broadcast hints
- Bonus—Monitoring and Configuration Tuning
… and so much more!
FAQs
How do I know if my Spark job is performing optimally?
Monitor job execution times, resource utilization, and shuffle operations using the Spark UI. Compare against established baselines and look for stages with high shuffle read/write or long execution times.
What is Spark performance tuning?
Spark performance tuning is the process of optimizing Spark configurations and application code to improve execution speed, resource utilization, and overall efficiency.
Why should I prefer DataFrames/Datasets over RDDs?
DataFrames and Datasets leverage Spark's Catalyst Optimizer for optimized execution plans, leading to better performance compared to RDDs.
What are shuffle operations, and why are they expensive?
Shuffle operations involve redistributing data across partitions, which can be costly in terms of performance due to network overhead and increased I/O operations.
What is Adaptive Query Execution (AQE)?
AQE is a feature introduced in Spark 3.0 that optimizes query plans at runtime based on statistics, allowing for dynamic adjustments to improve performance.
What's the most important factor in Spark performance?
There's no single most important factor, as it depends on your specific use case. However, data partitioning, minimizing shuffles, and effective use of caching are often critical for good performance.
Why is Spark UDF slow?
Spark UDFs are slow due to serialization overhead, lack of optimization by Catalyst, and row-by-row processing instead of columnar operations.
How do you optimize long running jobs in Spark?
Optimize long-running Spark jobs by:
- Partitioning data effectively
- Minimizing shuffles
- Caching intermediate results
- Using broadcast joins when applicable
- Leveraging Adaptive Query Execution
How to make Spark faster?
Improve Spark performance by:
- Using DataFrames/Datasets instead of RDDs
- Optimizing data partitioning
- Minimizing shuffle operations
- Utilizing built-in functions over UDFs
- Implementing effective caching
- Tuning configuration parameters
What are the 5 components of Spark?
The five main components of Spark are:
- Spark Core
- Spark SQL
- Spark Streaming
- MLlib (Machine Learning library)
- GraphX (Graph processing)
What is the RDD in Spark?
RDD (Resilient Distributed Dataset) is Spark's fundamental data structure. It's an immutable, distributed collection of objects that can be processed in parallel across a cluster.
What is the use of DAG in Spark?
DAG (Directed Acyclic Graph) in Spark represents the logical execution plan of a job. It optimizes the sequence of operations, combines transformations, and determines the most efficient way to execute the job across the cluster.
What is performance tuning of Spark application?
Performance tuning of Spark applications involves optimizing various aspects such as data processing, resource allocation, and job execution to improve speed, efficiency, and resource utilization of Spark jobs.