Managing cloud costs trips up a lot of organizations. The problem is, most teams just don't have the time or expertise to do it well. It's not just a technical difficulty; there are also cultural barriers. Engineers are too busy developing new features, finance teams want stable/predictable budgets, and leadership demands better cost control. According to the State of FinOps Report, majority of organizations now prioritize two things: enabling automation and encouraging engineers to act on cost-saving opportunities. FinOps tools are engineered to address these intersecting challenges—they can help improve cloud cost management and optimization, streamline resource provisioning, and decrease the need for time-consuming manual efforts to find savings. But here's the thing: there are a ton of FinOps tools out there, and choosing the right one can feel daunting.
In this article, we will deep dive into 13 FinOps tools that provide a clear view of your cloud spending and help you manage costs efficiently. Then, we’ll get into their features, pricing models, and the pros and cons of each, which should help you make a decision on the tool that best suits your needs.
Table of Contents
What Are FinOps Tools?
FinOps tools are solutions designed to help organizations manage, optimize, and govern their cloud spending. These tools enable financial accountability and operational efficiency by providing visibility into cloud costs, supporting collaboration across teams, and aligning spending with business goals. They are critical for navigating the complexities of cloud billing, offering features like granular cost allocation, anomaly detection, advanced forecasting, and real-time insights that connect cloud expenditures to specific products, features, or teams.
Here’s a detailed breakdown of the key features you’ll find in most FinOps tools:
1) Near Real-Time Dashboards & Reporting — FinOps tools provide continuous monitoring with customizable dashboards displaying frequently updated cost and usage data for timely decision-making.
2) Granular Cost Allocation and Chargeback/Showback — FinOps tools enable detailed tagging of cloud resources and precise cost allocation to specific entities, supporting chargeback and showback models.
3) Budgeting and Forecasting — FinOps tools analyze historical data to establish budgets and predict future expenses using analytical models.
4) Intelligent Anomaly Detection and Alerting — FinOps tools use automated monitoring and algorithms to identify unexpected cost deviations and trigger alerts.
5) Actionable Resource Optimization Recommendations — FinOps tools assess resource utilization and provide recommendations like rightsizing and identifying idle resources.
6) Multi-Cloud and Hybrid Cloud Support — Many FinOps tools integrate with multiple cloud providers (AWS, Azure, Google Cloud) and private cloud setups, providing a unified view of spending.
7) Automation of Cost Optimization Actions — FinOps tools can automate actions (e.g: scaling, scheduling) based on predefined policies to enhance cost efficiency.
8) Granular Tagging and Custom Views — FinOps tools enforce tagging policies and allow creation of tailored dashboards for specific stakeholder needs.
9) Custom Cloud Usage View — FinOps tools provide custom views tailored to specific cloud services and business units, offering clarity and focus.
10) Performance and Efficiency Metrics Tracking — FinOps tools track KPIs related to resource utilization and cost efficiency, enabling correlation with spending.
11) Integration Capabilities — FinOps tools offer APIs and integrations with DevOps, CI/CD, ITSM, and BI platforms.
12) Cloud Security and Compliance Cost Visibility — FinOps tools provide visibility into costs associated with cloud security and compliance efforts.
13) Containerization Support — FinOps tools support cost management for containerized environments such as Kubernetes. FinOps tools can help you manage costs at the cluster, namespace, or pod level, ensuring that you have visibility into your containerized workloads.
14) Integration with DevOps and CI/CD — FinOps tools integrate directly into development pipelines—helping engineers with real-time cost insights so that the financial impact of code changes is visible before deployment.
15) Cost Optimization for Serverless Architectures — FinOps tools offer insights and recommendations for optimizing serverless service costs.
… and so much more!
Why does this matter? Because cloud costs can easily spiral if left unchecked. FinOps tools aren't just about saving money (though they definitely help there); they reduce operational headaches. Are they perfect? Nope. Some might lag in supporting niche cloud services, others might generate too much noise with alerts. But the right FinOps tool often pays for itself multiple times over by finding savings and improving efficiency.
What Are the Benefits of Using FinOps Tools?
FinOps tools give you a clear picture of your cloud spending and reduce manual work. You get a single view of your costs and usage data, making it easy to spot trends and make changes. Let's take a closer look at the benefits.
1) Cost visibility
FinOps tools give you a clear, detailed picture of where your cloud spending is going. Instead of just getting a big, vague bill at the end of the month, you can see exactly which services, resources, and teams are consuming the most cloud resources.
2) Better Resource Optimization
FinOps tools help you identify underutilized or oversized resources. They give you the data you need to make smart decisions, like adjusting instance sizes, turning off idle resources, and picking the most cost-effective service tiers.
3) Improved Cross-Functional Collaboration
FinOps tools provide a common platform and a shared set of data that these different teams can use to understand and manage cloud costs together. Finance can see the overall spending, engineering can understand the cost implications of their architectural choices, and operations can identify inefficiencies in resource usage.
4) More Accurate Forecasting
FinOps tools use historical data and current trends to help you forecast your future cloud costs more accurately. Teams can track spending against budgets, receive alerts for potential overruns, and plan proactively, reducing the risk of unexpected expenses.
5) Increased Financial Accountability
FinOps tools that offer cost allocation and showback/chargeback capabilities help assign costs to specific teams or projects. Because of this, increased visibility and accountability can lead to more cost-conscious behavior and a greater sense of ownership over cloud spending.
6) Better Budgeting and Forecasting
FinOps tools provide you with real-time data and historical trends that you can use to create more realistic and data-backed budgets. You can track your spending against these budgets and receive alerts if you're on track to exceed them.
7) Enhanced Cloud Governance and Compliance
Cloud environments can become complex quickly, and it's easy for things to get out of hand if you don't have proper cloud governance in place. FinOps tools can help you establish and enforce cost-related policies, such as tagging requirements or spending limits.
8) Improved Negotiation with Cloud Vendors
Having detailed data on your cloud usage and spending can give you more leverage when negotiating contracts and discounts with your cloud providers.
9) Stronger Vendor Negotiations
Accessing comprehensive usage and spending data enables organizations to negotiate improved terms with cloud providers, such as volume discounts and more efficient contract structures. In multi-cloud or hybrid environments, FinOps tools help consolidate costs across different vendors, making it easier to manage and compare expenses.
Okay, we've covered what FinOps tools are and why they're useful. Now, let's compare the different types of tools you'll encounter before we dive into specific examples.
Comparing FinOps Tools: Native, Third-Party, and Open Source
Choosing a FinOps tool generally comes down to three categories: native tools (from your cloud provider), third-party platforms (from independent vendors), and open source solutions. They collect and show cloud cost data differently, which impacts how you track spending. Here’s the breakdown.
🔮 Native FinOps Tools
Native FinOps tools are the cost management tools that are built directly into the cloud platforms you're using. These are the tools your cloud provider hands you—AWS Cost Explorer, Azure Cost Management, GCP Cost Management. They draw data directly from your cloud account and present it through dashboards or built-in reports.
Native FinOps Tools Advantage:
- They hook right into your cloud platform. Data flows in real time
- You get detailed cost and usage breakdowns straight from the source
- Often available at no additional cost or with minimal charges for basic functionalities
- Easy to set up and use for fundamental cost tracking and reporting. Log in, click around, done
- Consistent data formats that match your provider’s billing system
- Seamless integration with the provider’s ecosystem—alerts, usage logs, and security events are centralized.
Native FinOps Tools Limitations:
- Limited to one cloud provider, which complicates multi-cloud management
- Features stay basic. Cost reports? Sure. Automation or detailed analytics? Nope
- Customization options are often restricted compared to third-party solutions
- Multi-cloud? Forget it. You’d need a separate tool for each provider.
Native FinOps tools work well if you're loyal to one cloud and need the basics. But if you use multiple providers or want more control, they're limited.
🔮 Third-Party FinOps Tools
Third-Party FinOps tools are solutions offered by independent software vendors. They are designed to connect to and analyze data from multiple cloud platforms, as well as potentially other sources such as data warehouse or lakehouse platforms, SaaS applications, and on-premises infrastructure. Some examples include Chaos Genius, VMware's CloudHealth, Apptio Cloudability, Datadog Cloud Cost Management, Splunk Observability Cloud, and more, which we will cover in more detail in the next section.
Third-Party FinOps Tools Advantage:
- Support for multi-cloud and hybrid environments. Some even extend to data warehouse or lakehouse platforms, SaaS applications, and on-premises infrastructure.
- Analytics go hard. Anomaly detection, predictive forecasts, you name it
- Wider range of integrations with external tools and platforms
- Ability to correlate data from different sources for a unified view
- More detailed reporting options that go beyond native functionality
Third-Party FinOps Tools Limitations:
- They cost you. Licensing fees and subscription costs can hit your budget, especially at scale
- Integration with native tools may require extra configuration
- There’s a learning curve. Feature overload might trip up your team at first
- Data can lag. Pulling from multiple APIs isn’t as easy as native tools
- Potential for vendor lock-in if relying heavily on one provider’s ecosystem
Third-party FinOps tools work best for multi-cloud management or advanced insights. They cost money and require effort, but they outperform native tools.
🔮 Open Source FinOps Tools
Open Source FinOps tools are developed and maintained by communities of developers. They offer transparency and a high degree of customization. Some examples include Kubecost, OpenCost, Infracost, Cloud Custodian, and more, which we will deep dive into later on.
Open Source FinOps Tools Advantage:
- Free to use or low cost compared to commercial products
- Highly customizable to match your internal processes
- Transparency rules. You can see—and tweak—every line of code
- Benefit from a community of users and shared improvements
- No vendor lock-in; you have control over your implementation
Open Source FinOps Tools Limitations:
- Technical expertise is often needed for setup and maintenance
- Formal support may be limited to community forums and documentation
- Integration with other enterprise systems may require additional work
- Updates and security patches depend on community contributions, which can vary
Open Source FinOps tools are a great fit if you have skilled developers and a tight budget. They need work but offer full freedom.
TL;DR: Choosing the Right FinOps Tool
- Native FinOps Tools: Best if you use just one major cloud provider, need basic cost tracking, and have a limited budget for tooling.
- Third-Party FinOps Tools: Suited for multi-cloud or hybrid environments, needing advanced analytics, automation, and a unified view across different platforms.
- Open-Source FinOps Tools: Good fit for tech-savvy teams wanting high customization, transparency, and avoiding vendor costs, provided you have the skills to manage them.
13 FinOps Tools & Platforms to Try in 2025
Alright, let's explore some specific FinOps tools you might want to consider. The one that's right for you will depend on your needs and the size and complexity of your cloud setup. We've rounded up 13 FinOps tools and split them into three groups: cloud-native tools, third-party tools, and open source options. For each tool,you'll find a brief overview, key features, pricing, pros and cons, and ideal use cases.
Note: Pricing information changes frequently and is often custom; always verify directly with the vendor.
🔮 Cloud Native & Third-Party FinOps Tools:
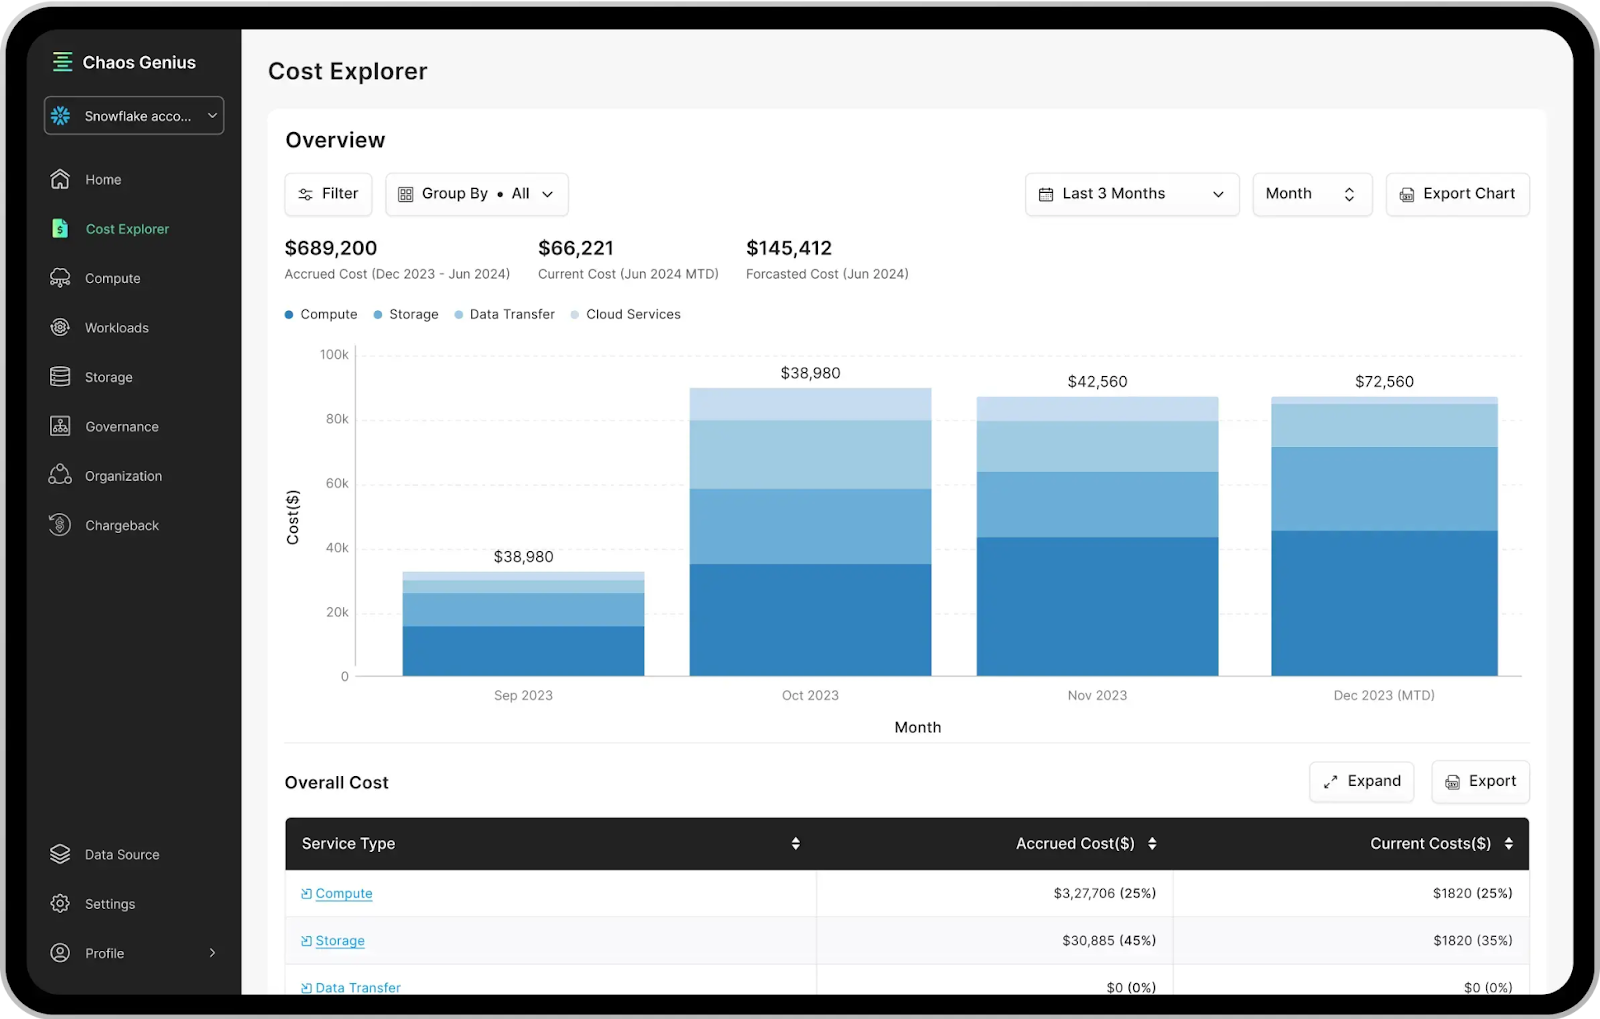
1) Chaos Genius
Chaos Genius is an AI-powered Data FinOps platform that specilizes in optimizing Snowflake and Databricks costs. It focuses on giving you detailed insights into the performance and costs associated with these services, helping you keep your spending in check and your systems running smoothly.
Official URL:

Key Features and Capabilities of Chaos Genius:
➥ Snowflake Costs Dashboard — Chaos genius provides a real-time view of all your Snowflake-related expenses, allowing you to monitor usage and pinpoint areas for potential cost reduction.
➥ Instance Rightsizing (for Snowflake) — Chaos genius helps you monitor and optimize your Snowflake warehouse costs by identifying underutilized infrastructure and suggesting automated rightsizing recommendations.
➥ Query Tuning (for Snowflake) — Chaos genius analyzes your query patterns to find inefficient queries and offers recommendations on how to improve their performance.
➥ Snowflake Storage Costs Optimization — Chaos genius examines your storage usage, identifies unused tables, and provides suggestions for optimizing your Snowflake storage costs.
➥ Anomaly Detection — Chaos genius uses smart algorithms to identify unusual usage patterns or unexpected costs in both Snowflake and Databricks, alerting you to potential problems quickly.
➥ Governance — Chaos Genius provides tools to help you establish and enforce cost-related policies.
➥ Usage Reports and Alerting — Chaos genius generates detailed reports on your Snowflake and Databricks usage and can send you alerts via email or Slack if any issues or anomalies are detected.
➥ Forecasting — Chaos Genius helps you predict your future cloud spending based on historical trends and usage patterns.
➥ Databricks Cost Monitoring — Chaos genius gives you a consolidated view of your entire Databricks environment, allowing you to track costs across clusters, regions, and usage over time.
➥ Databricks Spend Limits and Notifications — Chaos genius enables you to set monthly spending limits for Databricks and receive alerts via email or Slack if you're approaching or exceeding those limits.
➥ Databricks Cost Optimization Recommendations — Chaos genius analyzes your Databricks workloads and suggests ways to rightsize your clusters and identify costly queries that could be improved.
Pricing Details of Chaos Genius:
Chaos Genius offers different pricing tiers for Snowflake, and you'll need to sign up to get details for Databricks. Here's the breakdown:
For ❄️ Snowflake:
- Starter – $49 per month
- Usage: Tracks monthly costs up to US$2,500 (minimum tracked costs: $1000pm)
- Connected Accounts: 1 account
- Free Trial: Not available
- Features: Includes the Account Health Dashboard, Cost Explorer, Compute Optimization, Workload Optimization, Storage Optimization, Observability, Governance, Forecasting, and recommendations for Compute Optimization.
- Support: Access to the Slack Community; email support is provided on a best-effort basis
- Pro – $99 per month
- Usage: Supports monthly tracked costs up to US$7,500 (minimum tracked costs: $1000pm)
- Connected Accounts: Unlimited
- Free Trial: 7 days
- Features: All Starter features plus advanced functionality across the board
- Support: Slack Community, same-day email support, and a dedicated account representative
- Business – $349 per month
- Usage: Handles monthly tracked costs up to US$20,000 (minimum tracked costs: $1000pm)
- Connected Accounts: Unlimited
- Free Trial: 7 days
- Features: Same as Pro, with enhanced performance reporting and additional automation capabilities
- Support: Same-day email support and dedicated account rep
- Enterprise – Custom Pricing
- Usage: For monthly tracked costs exceeding US$20,000 (minimum tracked costs: $1000pm)
- Connected Accounts: Unlimited
- Free Trial: 7 days
- Features: Offers the full suite of functionalities, tailored integrations, advanced analytics and query tuning
- Support: Same-day email support, a dedicated account representative, and personalized service options available upon booking a demo
Our tiered plan lets you choose an option that suits your current Snowflake spending, and you can easily scale up as your needs increase. All our plans—Pro, Business, and Enterprise—come with a 7-day free trial, so you can try it before you buy it.
For 🧱 Databricks:
To get detailed pricing information for Databricks, you'll need to Sign up here with your work email.
Advantages of Chaos Genius:
- Provides complete visibility into Snowflake and Databricks warehouse performance and costs.
- Enables real-time monitoring and optimization of spending with helpful visualizations and recommendations for cost reduction.
- Uses anomaly detection to highlight abnormal behavior in your Snowflake and Databricks environments.
- Helps identify and improve inefficient Snowflake queries through query pattern analysis and recommendations.
- Assists in optimizing Snowflake storage costs by analyzing usage and identifying unused data.
- Offers detailed usage reports and alerting features to help you quickly spot and address issues.
- Offers a range of pricing tiers to suit different levels of Snowflake usage and needs.
- Even the Starter plan includes a solid set of core features.
- The Business and Enterprise plans provide a dedicated account representative for more personalized support.
Limitations of Chaos Genius:
- The 7 days Free trail is only available in Pro, Business and Enterprise tier.
- Alerting via Slack & Email reports is only available in paid options.
- Query Optimization Recommendations, and Query Tuning are only available in Enterprise tier options.
- Email support response times vary depending on the tier.
- Dedicated support is only available in the Business and Enterprise tier.
Ideal Use Cases of Chaos Genius:
- If you're working in a Snowflake environment and want a single dashboard to keep an eye on costs and performance.
- If you're working in a Databricks environment and need to track costs for clusters and jobs.
- If you're looking for automated help to make sure your resources are the right size, and you want to cut waste, with real-time alerts to catch any unusual cost changes.
Chaos Genius is a really useful tool, especially for organizations heavily reliant on Snowflake and/or Databricks. It helps you gain better control over performance and costs on these platforms. If you need a full AI-powered tool to detect unusual activity and receive specific optimization tips for your Snowflake warehouses, queries, and storage, Chaos Genius is the perfect choice. Not only that, it offers a wide range of features and tools to manage your Databricks expenses.
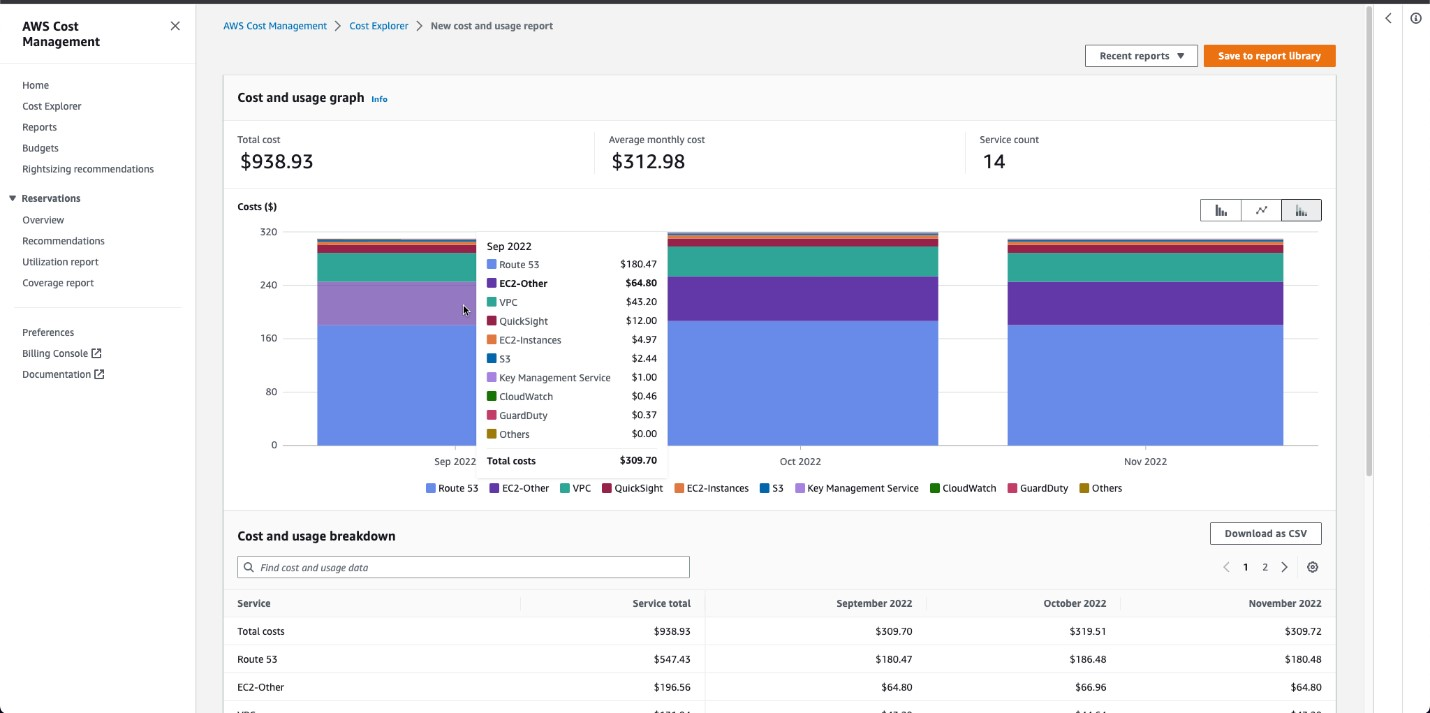
2) AWS Cost Management Tools (Cost Explorer & Budgets)
AWS Cost Explorer is a native FinOps tool designed to help you visualize, analyze, and forecast your AWS spending. It takes your raw AWS bill and turns it into charts, graphs, and reports you can actually use. You get a clear view of where your cost is flowing, spot trends, and figure out how to cut costs—all without leaving the AWS ecosystem.
Official URL:
Key Features and Capabilities of AWS Cost Explorer:
➥ Interactive Visualizations — AWS Cost Explorer provides intuitive charts and graphs that visually represent cost and usage trends over time.
➥ Granular Analysis — AWS Cost Explorer provides support for both daily and monthly views, enabling you to drill down into cost details with the desired level of granularity.
➥ Historical Data — AWS Cost Explorer provides access to up to 12–13 months of historical cost and usage data, which lets you analyze long-term spending trends and seasonal patterns.
➥ Cost Forecasting — AWS Cost Explorer provides cost forecasts for the upcoming 12 months based on historical data. These forecasts include confidence metrics, helping you gauge the reliability of predictions and plan your budget more effectively.
➥ Filtering and Grouping — AWS Cost Explorer provides robust filtering and grouping options that allow you to segment cost data by service, account, region, or custom tags for targeted analysis.
➥ Reserved Instances and Savings Plans Insights — AWS Cost Explorer provides specialized reports that analyze your usage of Reserved Instances and Savings Plans, along with recommendations for cost optimization.
➥ Custom Reports and Data Export — AWS Cost Explorer provides the capability to create, save, and share custom reports, and also enables you to export cost data as CSV files for offline analysis.
➥ API Access — AWS Cost Explorer provides an API that lets you programmatically access cost and usage data—each paginated API request incurs a nominal charge.
➥ Regular Data Refresh — AWS Cost Explorer provides data updates at least every 24 hours, making sure that the information in your reports remains current.
Pricing Details of AWS Cost Explorer:
AWS Cost Explorer is free to try out, you can explore, visualize your spending, and forecast costs without breaking the bank. But if you need to access its data through the API, that's where you'll start paying—$0.01 per request. Just a heads up, this can rack up if you're running lots of queries. And if you want hourly data for more detailed insights, the cost is $0.00000033 per usage record—that's about $0.01 for every 1,000 records per month.
Advantages of AWS Cost Explorer:
- Provides comprehensive access to cost and usage data for virtually every AWS service you use.
- Simple setup if you already use AWS, with no additional software required.
- Provides detailed and customizable views of your usage data.
- Provides access to up to 12–13 months of historical cost data.
- Offers a user-friendly interface with customizable charts and graphs to visualize cost breakdowns by service, region, or tags.
- Enables users to create custom reports and filter data by various dimensions for a detailed cost analysis.
- Offers recommendations to optimize spending through Reserved Instances and Savings Plans.
Limitations of AWS Cost Explorer:
- Limited to AWS; it does not combine data from other cloud providers.
- Requires a solid understanding of AWS billing concepts; the array of filters and options may overwhelm new users.
- Cost data is updated only every 24 hours.
- Detailed hourly granularity is only available for a limited 14‑day window.
- Lacks real-time cost spike alerts (use AWS Budgets for this functionality).
- May lack sufficient granularity for advanced use cases, such as per-resource tracking over long periods.
- Focuses on reporting and analysis rather than enforcing spending limits, necessitating additional tools for cost control.
Ideal Use Cases of AWS Cost Explorer:
AWS Cost Explorer is a powerful tool for optimizing cloud costs. For companies that use AWS exclusively, it provides a clear view of spending habits. This insight enables better financial decision-making. The tool's customizable reports and forecasting features are especially helpful for teams tracking expenses and setting AWS budgets. It's also a useful solution for organizations introducing FinOps practices, allowing them to easily track and forecast costs. This, in turn, supports the development of effective financial strategies.
a) AWS Budgets
Along with Cost Explorer AWS also provides budgets to help manage and optimize cloud costs. So to define AWS budgets. AWS Budgets is a tool that helps you stay in control of your AWS spending. It helps you monitor your spending and receive alerts when your budget thresholds are exceeded or are forecasted to be exceeded. It also works with AWS Budget Actions, which can trigger things to happen automatically or with your input when a budget limit is reached.
AWS Budgets Tutorial - Setup Alerts for AWS Billing | FinOps tools
Official URL:
Key Features and Capabilities of AWS Budgets:
➥ Cost Budgeting — AWS Budgets enables you to set and track actual and forecasted spending (unblended, blended, or amortized) while incorporating discounts, taxes, and refunds for precise cost control.
➥ Usage Budgeting — AWS Budgets lets you monitor specific AWS resource consumption (e.g: compute hours, data transfer) to prevent overprovisioning and manage free tier limits effectively.
➥ Reserved Instance (RI) Management — AWS Budgets tracks RI utilization and coverage, ensuring your prepaid reserved capacities are fully leveraged and instance hours are optimally covered.
➥ Savings Plans Management — AWS Budgets monitors Savings Plans utilization and coverage to verify that your committed spend aligns with actual usage, maximizing cost savings from long-term commitments.
➥ Custom Alerts & Notifications — AWS Budgets supports setting up email and Amazon SNS alerts based on actual or forecasted threshold breaches, enabling proactive responses to potential overspending.
➥ Automated Budget Actions — AWS Budgets allows you to configure actions (e.g: modifying IAM policies or restricting resource provisioning) that automatically execute when spending thresholds are exceeded.
➥ Multi-Dimensional Filtering — AWS Budgets offers filtering by AWS service, region, account, and cost allocation tags for granular tracking and precise cost allocation across various workloads.
➥ Integration with AWS Cost Explorer — AWS Budgets integrates with Cost Explorer to provide detailed cost and usage visualizations, enhancing the ability to analyze spending trends.
➥ Programmatic Access via API — AWS Budgets provides API support for automating budget creation, updates, and reporting, facilitating integration with CI/CD pipelines and custom cost management tools.
➥ Flexible Period Granularity — AWS Budgets can be set on daily, monthly, quarterly, or annual intervals—with data updates up to three times per day—ensuring timely monitoring and adjustments.
➥ Enterprise Scalability & Access Control — AWS Budgets supports the creation of up to 20,000 budgets per account and leverages IAM policies to restrict access, ensuring secure and scalable financial governance.
Pricing Details of AWS Budgets:
AWS Budgets is a free service offered by AWS. However, if you want to add actions to your budgets to control IAM permissions, Service Control Policies, or AWS resources when thresholds are exceeded, the first two action-enabled budgets are free per month, and each subsequent action-enabled budget incurs a $0.10 daily cost.
Advantages of AWS Budgets:
- Offers customizable limits based on cost, usage, and reserved resource metrics.
- Provides timely alerts via email or SNS so you can act before overspending occurs.
- Integrates directly with other AWS tools, giving you a seamless view of your spending data.
- Simple to set up if you already use AWS, with data pulled directly from your billing records.
Limitations of AWS Budgets:
- Works only within the AWS ecosystem; you must use another tool for multi-cloud environments.
- Data updates may lag by around 24 hours, limiting near real-time tracking.
- Advanced configuration options (like setting up complex budget rules and actions) may require additional technical knowledge.
- Visualization options are not as rich as those in AWS Cost Explorer.
- Creating a large number of budgets or utilizing Budget Actions will incur additional charges.
Ideal Use Cases of AWS Budgets:
AWS Budgets helps you track your overall AWS spending against predefined limits. With AWS Budgets, you set up alerts that notify your finance or engineering teams when spending nears or exceeds allocated amounts for projects or departments. You can take automated actions—like stopping EC2 instances or adjusting IAM policies—to keep costs in check. AWS Budgets also lets you monitor the utilization of Reserved Instances and Savings Plans so you capture more savings from your commitments. This tool works well for startups and small businesses with strict financial oversight, as well as for project and IT managers who need to keep a close eye on cloud expenses. You can even schedule regular reports that update all your stakeholders on your budget status.
3) Microsoft Cost Management + Billing & Azure Advisor
Microsoft Cost Management is your essential toolkit for managing Azure cloud costs. Integrated directly into the Azure platform, it provides a comprehensive suite of FinOps tools to monitor spending, establish budgets, and identify potential savings—all in real time. Designed for organizations running workloads on Azure, Microsoft Cost Management helps you prevent unexpected charges, optimize resource usage, and gain deep insights into your cloud expenditure. It integrates with Azure Advisor for cost optimization recommendations and leverages Microsoft Copilot in Azure (currently in Preview) to offer AI-driven insights, making it an invaluable resource for modern cloud financial governance.
Official URL:

Key Features and Capabilities of Microsoft Cost Management:
➥ Cost Visualization — Microsoft Cost Management provides detailed charts and graphs to display consumption trends and cost breakdowns by resource, service, or tag, facilitating quick insights into spending patterns.
➥ Budgeting and Forecasting — Microsoft Cost Management allows you to set budgets with fixed amounts at various scopes(subscription, resource group, management group), configurable to reset periodically, and generates forecasts based on historical usage patterns to help monitor and manage spending.
➥ Cost Alerts — Microsoft Cost Management sends notifications via email or integrated services when your spending or usage nears predefined thresholds, enabling proactive responses to potential overspending.
➥ Cost Allocation — Microsoft Cost Management uses tagging and custom rules to distribute costs across business units, projects, or departments, facilitating chargeback and showback processes.
➥ Integration with Azure Advisor and Copilot (Preview) — Integrates with Azure Advisor for cost optimization recommendations and leverages Microsoft Copilot in Azure for real-time cost insights and assistance.
➥ Export and Reporting — Microsoft Cost Management enables the creation of custom reports and data exports for further analysis, with seamless integration into Power BI for enhanced data visualization.
➥ Security and Compliance — Microsoft Cost Management aligns with Microsoft’s extensive compliance portfolio and supports role-based access to protect sensitive financial data.
Pricing Details of Microsoft Cost Management:
Microsoft Cost Management for Azure is available at no additional cost for Azure users. It comes included with your Azure subscription, allowing anyone with access to a billing account, subscription, resource group, or management group to utilize its features without incurring extra charges.
Advantages of Microsoft Cost Management:
- Native integration means your data comes directly from Azure, making reporting consistent and reliable.
- Easy access to detailed cost and usage data at various scopes (subscription, resource group, management group).
- Customizable dashboards and reports let you tailor the view to your team’s needs.
- Real-time insights, forecasting, and alerting help you stay on top of your spending.
- Free to use for Azure subscribers, which keeps total cost low.
Limitations of Microsoft Cost Management:
- Designed exclusively for Azure workloads; additional tools are required for multi-cloud environments.
- Some advanced configurations and customizations may require extra technical expertise, particularly in larger deployments.
- Initial configuration and understanding the full breadth of capabilities can be time-intensive for some organizations.
Ideal Use Cases of Microsoft Cost Management:
Microsoft Cost Management is ideally suited for organizations that operate exclusively within the Azure ecosystem and need a native solution to track, analyze, and optimize cloud spending. It serves teams that demand detailed cost allocation and forecasting to efficiently manage departmental or project budgets. Also, the tool integrates seamlessly with other Azure services—such as Azure Advisor and Power BI—enabling businesses to perform comprehensive financial analysis and gain deeper insights into their spending patterns. Enterprises that prioritize cost-effectiveness and seek to minimize additional expenses for budget monitoring and optimization will find Microsoft Cost Management to be a robust and efficient solution.
a) Azure Advisor
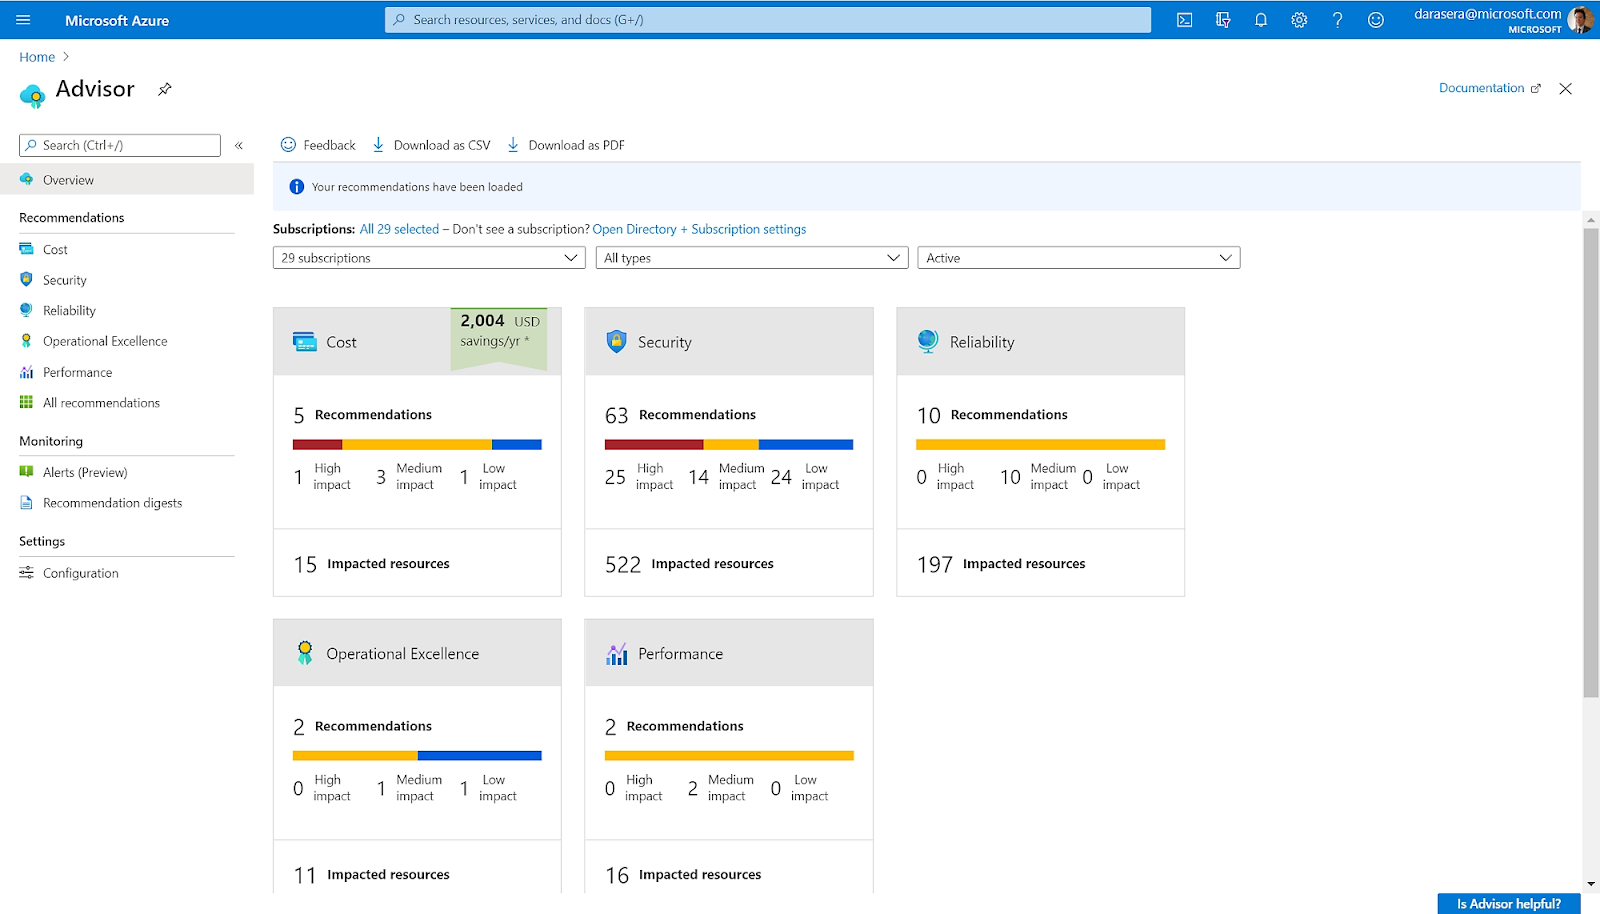
As we’ve talked about Microsoft’s cost management tools, Azure Advisor falls under the same suite and focuses on improving your Azure deployments. Azure Advisor acts like a built-in consultant, monitoring your resources and giving you personalized recommendations to lower costs, boost performance, and improve security and reliability.
Official URL:

Key Features and Capabilities of Azure Advisor:
➥ Personalized Recommendations — Azure Advisor analyzes your resource configurations and usage data, providing tailored recommendations across five core areas—Cost, Security, Reliability, Operational Excellence, and Performance—to help you optimize your Azure environment.
➥ Cost Optimization — Azure Advisor identifies idle or underutilized resources and provides recommendations—such as resizing virtual machines or shutting down unused instances—to reduce expenses. It also suggests cost-saving options like purchasing Azure Reservations or Savings Plans for predictable workloads.
➥ Performance Insights — Azure Advisor detects performance bottlenecks and recommends adjustments such as upgrading to Premium SSDs for I/O-intensive applications, optimizing VM sizes based on utilization, or enabling accelerated networking to boost throughput.
➥ Security Guidance — Azure Advisor integrates with Microsoft Defender for Cloud (formerly Azure Security Center) to provide actionable security recommendations, helping you improve your security posture and meet compliance requirements.
➥ Reliability Enhancements — Azure Advisor suggests measures such as setting up automated backups or enabling resource replication to improve service continuity and application reliability.
➥ Centralized Dashboard — Azure Advisor presents a consolidated view of all recommendations along with an Advisor score, reflecting how well your deployments adhere to Azure best practices.
➥ Integration with Azure Tools — Azure Advisor works seamlessly with other Azure services to provide a holistic view of your cloud spending and operational health.
Pricing Details of Azure Advisor:
Azure Advisor is free for Azure users and is included with your existing Azure subscription. Just remember, some of its recommendations may require additional costs to implement.
Advantages of Azure Advisor:
- Native integration means you get data directly from your Azure environment.
- Offers a single dashboard with actionable insights across cost, performance, security, and reliability.
- Simple access via the Azure portal and seamless integration with other Microsoft tools.
- Free to use, which keeps your overall expenses low.
Limitations of Azure Advisor:
- Limited to Azure, so it doesn't cover multi-cloud setups.
- Some recommendations require manual action or extra configuration.
- Depth of recommendations can vary across different services; in some cases, additional tools may be needed for comprehensive analysis.
Ideal Use Cases of Azure Advisor:
Azure Advisor is best suited for organizations primarily operating in Azure that require a builtin tool to monitor and optimize resource usage. It delivers clear, actionable recommendations to reduce spending and enhance performance, while offering a consolidated view of the environment to guide cost-saving measures and operational adjustments. On top of that, it integrates well with other Azure‑native tools to support a comprehensive FinOps strategy.
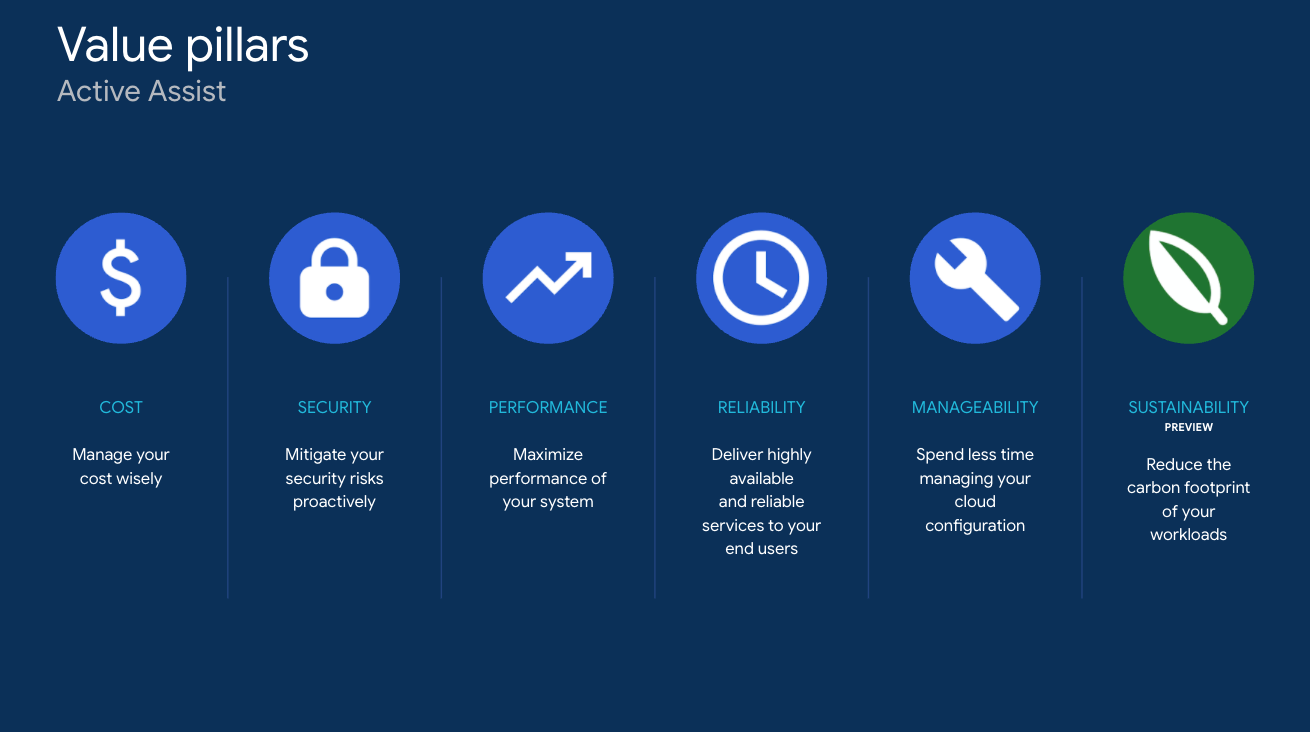
4) Google Cloud Cost Management & Recommender
GCP Cost Management provides built-in FinOps tools within the Google Cloud Platform console that allow you to monitor, control, and optimize your Google Cloud costs. It offers comprehensive features—including cost reporting, budget setting, forecasting, and actionable recommendations—to help you use your resources more efficiently and avoid unexpected charges.
Google Cloud's cost management tools - FinOps tools
Official URL:
Key Features and Capabilities of GCP Cost Management:
➥ Cost Reporting and Visualization — GCP Cost Management provides granular visibility through Cloud Billing Reports, which map costs to Google Cloud’s service taxonomy (e.g: Compute Engine SKUs, Cloud Storage buckets). Custom dashboards via Looker Studio enable multi-dimensional analysis (e.g: costs by project, region, or label), while Cost Explorer visualizes trends using ML-driven anomaly detection
➥ Budgeting and Forecasting — GCP Cost Management supports ML-powered forecasting to predict monthly spend based on historical usage, with budgets configurable at the project, folder, or organization level. Forecasts account for sustained use discounts (SUDs) and committed use contracts (CUDs), enabling accurate financial planning.
➥ Resource Hierarchy and Access Controls — GCP Cost Management enforces financial governance through a hierarchical structure:
- Organizations: Central policy enforcement for enterprise-scale governance.
- Folders/Projects: Group resources by department or workload for chargeback/showback.
- Labels: Attribute costs to custom dimensions (e.g:
env:prod,team:finance).
Granular IAM roles (e.g: Billing Account Viewer, Cost Management Admin) restrict access to cost data, ensuring compliance with least-privilege principles
➥ Budgets and Alerts — GCP Cost Management allows threshold-based alerts (absolute amounts or percentage of forecast) with programmatic responses. For example, Pub/Sub-triggered workflows can disable billing for a project or throttle resource provisioning via Cloud Functions.
➥ Billing Exports and APIs — GCP Cost Management automates billing data exports to BigQuery in hourly/daily increments for advanced analysis and custom reporting. The Cloud Billing API also allows integration with analytics tools like Looker Studio, giving you greater flexibility in visualizing and analyzing cost data.
➥ Cost Recommendations — Leverage Google Cloud Recommender to receive actionable insights. The tool highlights underutilized resources and suggests rightsizing opportunities, along with guidance on optimizing committed use discounts to maximize savings.
Pricing Details of GCP Cost Management:
The core cost management features (budgets, reports, Recommender) within GCP Cost Management—along with 24/7 billing support—are offered at no additional charge for Google Cloud customers. You only pay for the underlying Google Cloud services you actually use (such as compute, storage, and networking). Should you choose to export billing data to BigQuery or utilize services like Pub/Sub or Cloud Functions in conjunction with Cost Management, standard service pricing will apply.
For detailed pricing, you can try the Google Cloud Pricing Calculator.
Advantages of GCP Cost Management:
- Directly integrated with Google Cloud, guranteeing immediate access to accurate and up‑to‑date usage data.
- Comprehensive cost reporting and forecasting tools help you plan your spending accurately.
- Built‑in resource hierarchy and labeling enable precise cost allocation across projects, folders, and departments.
- No additional charge for cost management features makes it cost-effective.
- Supports automated data exports to BigQuery for advanced custom reporting and analysis.
Limitations of GCP Cost Management:
- Limited to Google Cloud; it does not combine data from other providers.
- Exporting data to BigQuery or using additional services (such as Pub/Sub) for custom workflows may incur extra charges.
- Setting up highly customized dashboards and alerts can be complex, especially for organizations with diverse reporting needs.
Ideal Use Cases of GCP Cost Management:
GCP Cost Management is best suited for organizations exclusively operating within Google Cloud that require a native solution to track and manage spending. It is designed for teams that need granular cost breakdowns by projects, folders, or labels, enabling precise allocation and accountability. Also, it integrates seamlessly with custom analytics tools such as Looker Studio and BigQuery to deliver deeper financial insights, while supporting automated alerts and actions to keep spending on track without extensive manual intervention.
b) GCP Recommender
GCP Recommender is a native FinOps tool that provides you with actionable insights to optimize your Google Cloud resources. It uses historical usage data and machine learning to suggest ways to right-size resources, eliminate idle capacity, and adjust configurations for improved performance and cost efficiency.
Official URL:
Key Features and Capabilities:
➥ Actionable Recommendations — GCP Recommender delivers specific guidance on rightsizing virtual machines, adjusting resource configurations, and identifying underutilized assets. Recommendations are tailored to help reduce waste and improve resource utilization.
➥ Real-Time Insights — GCP Recommender leverages historical data and current usage metrics to provide timely recommendations that help you reduce waste and control spending. These insights are based on real-time monitoring of resource usage.
➥ Programmatic Access — GCP Recommender offers an API for integrating recommendations into your existing workflows, such as CI/CD pipelines, so you can automate cost optimization actions.
➥ Customizable Scope — GCP Recommender lets you target recommendations at the level of projects, folders, or individual resources, giving you granular control over cost management.
➥ Feedback Loop — GCP Recommender tracks actions taken based on recommendations and updates you on potential savings, helping you measure the impact of your optimizations.
Pricing Details of GCP Recommender:
GCP Recommender is offered at no additional charge as part of your Google Cloud services—you only pay for the underlying resources and any related service usage. There are no extra fees specifically for utilizing the recommender service.
Pros:
- Native integration with Google Cloud means you get direct access to detailed resource data.
- Provides clear, actionable advice to help you make informed adjustments quickly.
- API access enables you to integrate recommendations into your automation workflows seamlessly.
- No extra cost for using the recommender service on top of your regular GCP charges.
Cons:
- GCP Recommender is limited to Google Cloud resources; it does not extend to multi-cloud environments.
- Some recommendations may require manual intervention if you opt out of automation.
- The accuracy of insights depends on the quality and consistency of your usage data and tagging practices.
Ideal Use Cases of GCP Recommender:
GCP Recommender is best suited for organizations operating exclusively within the Google Cloud ecosystem, delivering targeted recommendations to optimize costs and enhance performance. It enables teams to integrate automated recommendations into their CI/CD pipelines, allowing real-time adjustments to resource configurations. Additionally, organizations can use it to minimize idle or underutilized resources, fine-tuning configurations for cost-efficient operations.
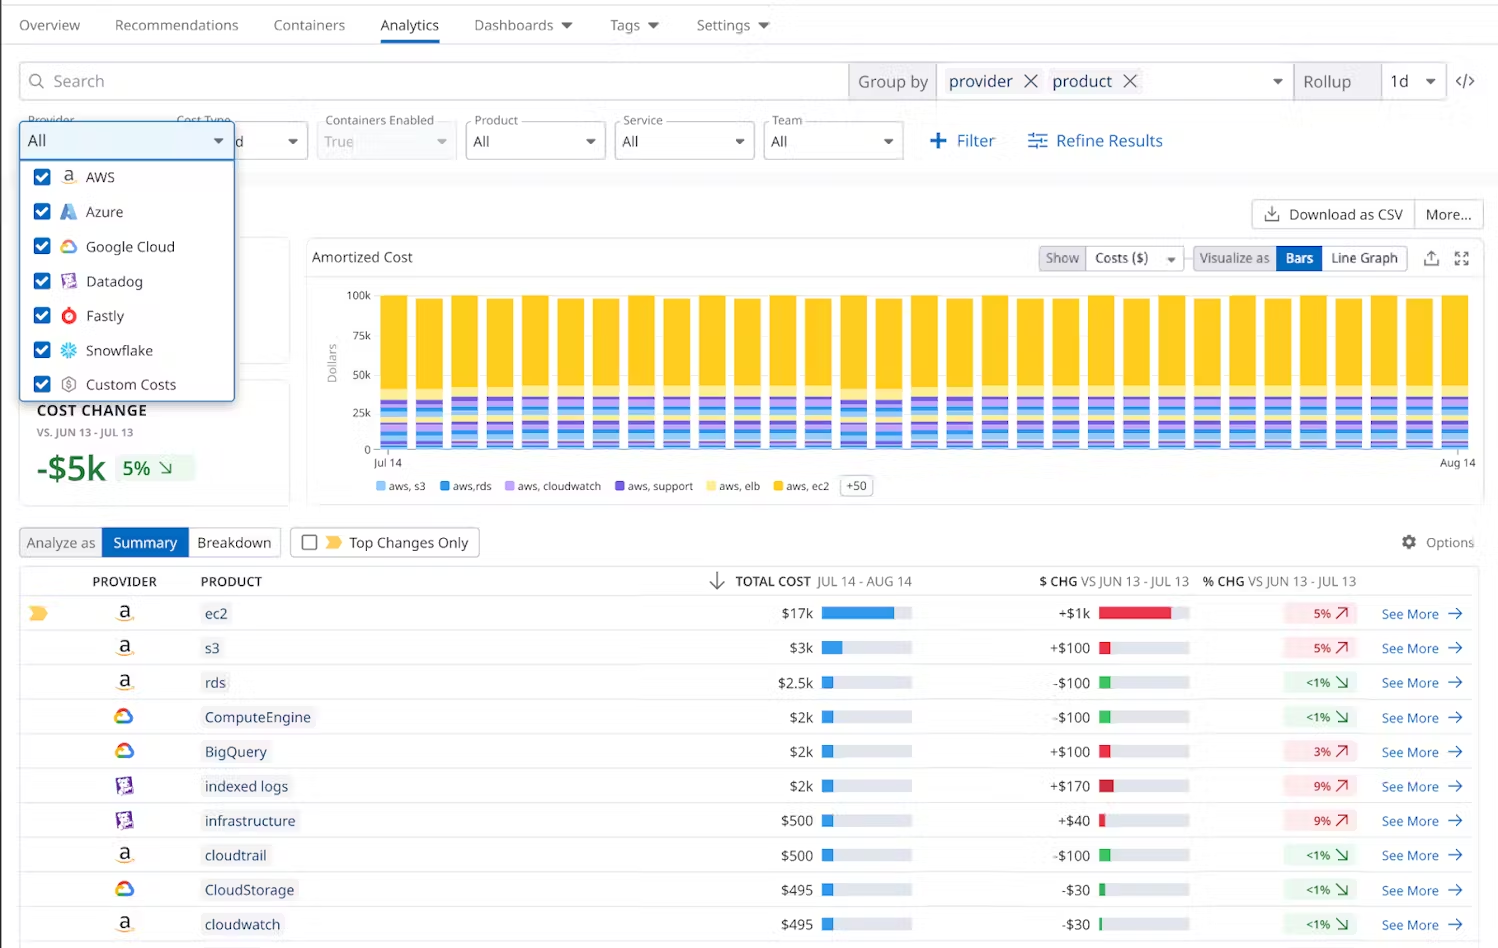
5) Datadog Cloud Cost Management
Datadog is another FinOps tool that provides you with a comprehensive view of your tech stack's performance. This cloud monitoring and analytics platform consolidates data from your infrastructure, applications, logs, and security into a single dashboard. If you’re managing a cloud application and need to quickly identify issues, this tool is here to help. It’s designed for teams seeking a clear understanding of their operations—whether servers are running smoothly, applications are experiencing delays, or logs require immediate attention—without the need to switch between multiple tools.
Official URL:
Key Features and Capabilities:
➥ Cost Visibility — Datadog Cloud Cost Management aggregates cost data from AWS, Azure, Google Cloud, and SaaS providers like MongoDB, OpenAI, Databricks, and Snowflake. It normalizes this data using the FinOps FOCUS standard and displays it in a centralized dashboard for unified, cross-provider expense tracking.
➥ Cost Attribution — Datadog Cloud Cost Management uses tags and metadata to allocate costs to specific teams, services, or resources. It leverages Datadog’s tagging system for granular expense categorization and identification of cost drivers.
➥ Optimization Recommendations — Datadog Cloud Cost Management analyzes usage and billing data with machine learning to provide automated cost-saving suggestions, such as rightsizing underutilized instances, terminating orphaned resources, or switching to cost-efficient service tiers.
➥ Observability Integration — Datadog Cloud Cost Management correlates cost data with performance metrics (e.g: CPU, memory, network usage) from Datadog’s observability suite, enabling identification of cost inefficiencies linked to specific workloads.
➥ Multi-Cloud Support — Datadog Cloud Cost Management tracks costs across AWS, Azure, Google Cloud, and SaaS tools like Databricks and Snowflake, normalizing data with the FinOps FOCUS standard for consistent multi-cloud analysis.
➥ Custom Cost Upload — Datadog Cloud Cost Management supports uploading custom cost data in FinOps FOCUS format, integrating expenses from private clouds or on-premises infrastructure into its analysis.
➥ Alerts — Datadog Cloud Cost Management enables custom alerts for cost anomalies, budget thresholds, or spending trends, integrated with Datadog’s monitoring system to trigger notifications based on user-defined conditions.
➥ Tag Pipelines — Datadog Cloud Cost Management automates tag application and management across cloud resources, dynamically categorizing expenses using resource metadata for consistent cost allocation.
Pricing Details of Datadog CCM:
Datadog Cloud Cost Management typically starts at $7.50 per host per month when billed annually, with on-demand pricing at about $10.80 per host per month. A host is defined as an instance or virtual machine from providers like AWS, Azure, or Google Cloud that appears in your cost reports. Actual expenses depend on factors such as data volume, number of hosts, and any additional features used.
Advantages of Datadog CCM:
- Combines cost and observability data in one platform.
- Provides detailed cost breakdowns by service, team, or project.
- Offers automated recommendations to reduce waste.
- Supports cross-cloud analysis using standardized FOCUS data.
Limitations of Datadog CCM:
- The added functionality can increase complexity for smaller environments.
- Costs can rise quickly for organizations with large or dynamic cloud footprints.
- Some advanced optimization features are still developing.
Ideal Use Cases of Datadog CCM:
Datadog Cloud Cost Management is well-suited for organizations that use Datadog for monitoring and want a single platform for tracking both performance and cloud spending. It works best for teams that need to analyze expenses across multiple cloud providers or SaaS services and require detailed cost allocation. Engineering and FinOps teams benefit from using Datadog Cloud Cost Management to make informed decisions about resource allocation and to react promptly to cost anomalies.
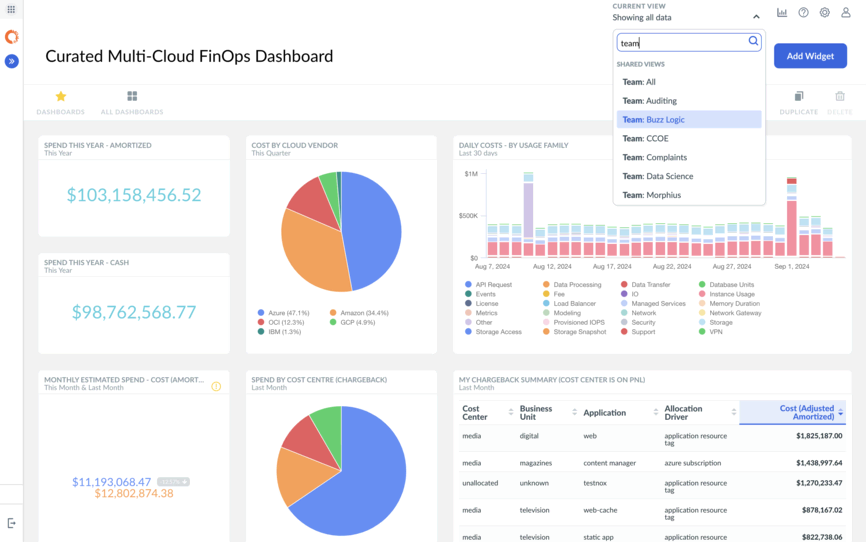
6) Apptio Cloudability (Acquired by IBM)
Apptio Cloudability is a market-leading FinOps tool designed to consolidate multi-cloud spending data, automate cost optimization, and align cloud investments with business value. Acquired by Apptio in 2019 and now part of IBM, it provides granular visibility into cloud costs across AWS, Azure, Google Cloud, and containerized environments like Kubernetes. The platform helps organizations to monitor expenses, allocate costs accurately, forecast budgets, and implement performance-safe optimization actions to reduce waste and overspending.
Official URL:
Key Features and Capabilities:
➥ Multi-Cloud Cost Visibility — Cloudability ingests raw billing data from AWS, Azure, GCP, and hybrid/containerized environments (e.g: Kubernetes, OpenShift) into a unified dashboard.
➥ Automated Cost Optimization — Cloudability uses machine learning to generate rightsizing recommendations for overprovisioned VMs, idle storage volumes, and underutilized databases. It automates policy-driven actions like terminating unattached EBS volumes after user-defined grace periods and scheduling EC2/RDS shutdowns during off-peak hours.
➥ Unit Economics & Business Value Mapping — Cloudability correlates cloud spend to business KPIs (e.g: cost per customer, feature, or transaction) using its Business Mapping Engine.
➥ Container/Kubernetes Cost Allocation — Cloudability collects pod/namespace-level metrics (CPU, memory, storage) from Kubernetes clusters and allocates costs using declarative labels. It supports OpenShift integrations and provides cost-per-workload insights, including idle container resource waste detection.
➥ Forecasting & Budgeting — Cloudability applies ARIMA-based predictive analytics to forecast spend 6–24 months ahead, incorporating variables like seasonal usage patterns and commitment discounts.
➥ Collaborative FinOps Workflows — Cloudability provides role-tailored dashboards (Engineering, Finance, Leadership) with granular access controls.
➥ Sustainability Insights — Cloudability calculates Scope 3 carbon emissions using cloud provider-specific sustainability APIs (e.g: AWS Customer Carbon Footprint Tool).
➥ Commitment Management — Cloudability optimizes Reserved Instance/Savings Plan purchases via utilization forecasting algorithms. It identifies coverage gaps (e.g: unallocated AWS RIs) and recommends exchanges/modifications to achieve >90% commitment efficiency.
➥ Anomaly Detection & Governance — Cloudability monitors cost variances using 7-day rolling Z-score analysis. It triggers Slack/PagerDuty alerts for anomalies (e.g: unapproved service deployments) and enforces tagging policies via automated governance workflows.
➥ Integrations & Extensibility — Cloudability integrates with Datadog, ServiceNow, Snowflake and more. Its REST API supports custom FinOps workflows and Terraform-driven cost policy automation.
Apptio Cloudability Pricing Details (as of early 2025, requires contact):
Apptio Cloudability doesn’t offer a simple “list price”—its pricing is custom and typically based on factors such as your annual cloud spend, contract terms, and additional usage. For example, one AWS Marketplace listing showed tiered pricing with 12‑month contracts roughly as follows:
• Manage up to $1M of annual cloud spend for about $30,000 per year
• Manage up to $3M for roughly $76,680 per year
• Manage up to $6M for around $132,480 per year
Overages are charged on a per‑unit basis if your cloud spend exceeds the contracted amount. In some regions (like the UK), you might also see pricing such as £21,000 per license per year with options for free trials and educational discounts.
Because many factors can influence the final quote, it’s best to request a personalized pricing proposal from Apptio.
Pros:
- Streamlines cost management for hybrid and multi-cloud environments.
- Automates recommendations that reduce unit costs by 30%+ and increase commitment coverage to 90%+.
- Supports large organizations with complex cloud spend.
- Integrates with FinOps best practices for cross-team collaboration.
- Enables automated showback/chargeback with 100% cost allocation accuracy.
Cons:
- Lacks detailed cost-per-feature or per-deployment insights critical for SaaS pricing decisions.
- Cost allocation relies heavily on tagging strategies, which can be challenging to maintain.
- Pricing tiers are prohibitive for startups or small businesses.
- Limited extensibility compared to competitors.
Ideal Use Cases:
Apptio Cloudability excels in unifying multi-cloud financial management for enterprises but requires significant investment in training and tagging strategy. Its strength lies in automating savings for mature FinOps teams, though smaller organizations may find alternatives like CloudZero more cost-effective for granular insights
7) CloudHealth by VMware
CloudHealth by VMware is a complete multi-cloud management platform designed to help organizations optimize costs, streamline operations, and enhance governance across public, private, hybrid, and containerized cloud environments. Acquired by VMware in 2018, CloudHealth integrates with major cloud providers like AWS, Azure, Google Cloud, and Oracle Cloud, and VMware Cloud on AWS, offering unified visibility, automated governance, and FinOps-aligned workflows through a SaaS model.

Official URL:
Key Features and Capabilities:
➥ Multi–Cloud Visibility & Consolidation — CloudHealth ingests billing data from AWS, Azure, GCP, and Oracle Cloud, normalizing it into a single dashboard. It supports hybrid environments through bi-directional integration with VMware vRealize Operations for on-premises cost tracking.
➥ Cost Optimization & Resource Rightsizing —CloudHealth provides rightsizing recommendations for underutilized VMs, idle storage (e.g: disconnected EBS volumes), and Reserved Instance/Savings Plan management. It reduces compute costs by up to 35% through bulk pricing negotiations with cloud providers.
➥ Advanced Reporting & Analytics — VMware CloudHealth delivers customizable dashboards and detailed reports—including historical trends, forecasting, and anomaly detection—to facilitate proactive financial management.
➥ Policy–Based Governance & Automation — CloudHealth enforces budget alerts (e.g: 80% monthly spend thresholds) and automated cleanup policies for wasted resources. Rules can trigger actions like terminating unused elastic IPs or aging snapshots.
➥ Kubernetes Cost Allocation — Limited Kubernetes visibility allows basic cost tracking by cluster and namespace but lacks granular pod-level insights or workload-specific optimization recommendations.
➥ Extensive API Integration — VMware CloudHealth offers REST and GraphQL APIs for seamless integration with existing IT systems and third–party tools, supporting programmatic control and customization.
➥ Forecasting & Budgeting — VMware CloudHealth uses historical trends for 6–24 month spend predictions, though users report inaccuracies in forecasts and inflexible anomaly detection.
➥ Chargeback/Showback — VMware CloudHealth allocates costs to departments or projects using Perspectives, though accuracy depends on rigorous tagging strategies. Supports custom pricing markups for MSPs.
➥ Security & Compliance — CloudHeath is integrated with VMware Tanzu GuardRails for real-time risk detection, IAM monitoring, and policy enforcement across multi-cloud environments.
VMware CloudHealth Pricing Details:
VMware CloudHealth offers a subscription-based pricing model with two primary structures depending on cloud expenditure tiers and additional modules:
1) Percentage-Based Pricing
- 3.6% of monthly cloud expenditure for organizations with cloud spend exceeding $100,000–$150,000.
- Minimum 12-month contract required.
- Discounts available for extended contract terms or higher cloud spend/virtual machine (VM) volumes.
2) Fixed Annual Costs
- AWS-specific tiers (via AWS Marketplace):
- $41,904/year for AWS spending over $100,000.
- $45,000/year for AWS spending under $150,000.
- Higher tiers (e.g: $300,000/month AWS spend) cost up to $396,000/year
3) Additional Modules
- Data Center Module:
- $2.50 per VM/month for on-premises or private cloud infrastructure management.
- Secure State:
- $13,800/year for security compliance monitoring (covers 100 cloud resources).
4) Trials:
- 14-day free trial available.
Pros:
- Provides centralized monitoring across AWS, Azure, Google Cloud, and hybrid environments, enabling unified reporting and cost tracking.
- Identifies underutilized resources, automates rightsizing, and enforces policies to reduce waste.
- Pre-populated dashboards reduce public cloud spend by 30–35% through waste elimination and Reserved Instance optimizations
- Offers customizable dashboards for granular analysis of cloud spend, usage trends, and anomaly detection.
- Seamless compatibility with vRealize Operations and Tanzu GuardRails for unified infrastructure monitoring
- Supports containerized workloads and integrates with on-premises infrastructure for hybrid cloud management
Cons:
- Designed for enterprises with multi-cloud environments; smaller teams may find it overwhelming or resource-intensive.
- Limited Kubernetes Support; no pod-level cost allocation or workload-specific rightsizing recommendations
- Budget predictions often deviate from actual spend due to static historical trend analysis.
- Functionality varies across cloud providers (e.g: AWS-centric features like Secure State offer less value for Azure/GCP users).
- Requires near-perfect asset tagging for accurate data collection, which can be time-consuming.
- Lacks per-unit cost tracking (like cost per customer or deployment), focusing instead on departmental/project-level allocation.
- Cost allocation accuracy hinges on consistent tagging; challenging to enforce at scale.
Ideal Use Cases:
CloudHealth is ideal for organizations needing robust cloud cost management and compliance tools. Large enterprises spending over $1M annually on multiple clouds benefit from its centralized governance. MSPs use it to offer customized cloud services with white-labeled dashboards. For VMware-focused teams, it integrates with vRealize and Tanzu GuardRails for hybrid cloud management. Businesses can optimize Reserved Instances to negotiate better discounts with major cloud providers. Additionally, it provides audit-ready reports essential for regulated industries complying with SOC 2, HIPAA, or GDPR.
8) Splunk Cloud Data Platform
Splunk Cloud Platform is Splunk's core data platform, but delivered as a software-as-a-service (SaaS) offering. You can collect data from thousands of sources at terabyte scale, run advanced searches, and leverage integrated machine learning to spot issues before they become problems.
Official URL:
Key Features and Capabilities of Splunk Cloud Data Platform :
➥ Data Ingestion and Indexing — Collect and index data from diverse sources. The system handles terabyte-scale ingestion so you never miss critical events.
➥ Real-Time Search and Analysis — Use Splunk’s search processing language (SPL) to perform fast, in-depth queries. This helps you explore any type of machine data across your environment.
➥ Dynamic Dashboards and Visualizations — Create interactive dashboards that present complex data in a clear, actionable format. You can share these views with your team across devices.
➥ Federated Search Across Environments — Correlate data from on-premises systems, cloud sources, and external platforms to build a unified picture for threat detection and reporting.
➥ Collaborative Tools — Access your data anywhere through mobile apps and even augmented reality tools, keeping your team connected in real time.
➥ Built-In AI and Machine Learning — Leverage free machine learning apps such as the Splunk AI Assistant, Anomaly Detection Assistant, and the Machine Learning Toolkit. These tools help you enhance decision-making and improve threat response times.
Pricing Details of Splunk (as of early 2025):
Splunk offers flexible pricing options designed to match your usage patterns and business needs. The primary models are:
- Workload Pricing
Charges are based on compute capacity (measured in Splunk Virtual Compute units). This model adapts to varying search activity and scale. - Ingest Pricing
Costs depend on the volume of data ingested per day. This straightforward model is ideal if your focus is on data volume. - Entity Pricing
This option ties pricing to the number of assets or hosts you monitor. It suits environments where defined use cases in IT and security drive data consumption.
For more details, you can visit the Splunk pricing page.
Pros:
- Centralizes diverse data sources and streamlines alert workflows.
- User-friendly interface with intuitive dashboard creation.
- Powerful search capabilities and fast indexing.
- Rich ecosystem of add-ons and integrations.
- Reduces infrastructure management overhead.
Cons:
- Lags behind competitors with delayed feature updates.
- Considered expensive compared to similar solutions.
- SPL query language is complex and not very intuitive.
- Limited ease for downloading configuration changes and editing settings.
- Advanced features can be challenging to set up and configure.
Ideal Use Cases:
Splunk Cloud Platform is made for enterprises needing to collect logs from many systems and analyze them in real time. It gathers a large volume of machine data from on-premises systems and cloud applications. This allows for quick troubleshooting, security monitoring, and performance tracking. The platform is built to handle heavy loads and includes machine learning features. These help identify anomalies and provide answers to complex questions. It's a solid option for businesses with significant data and dynamic operational needs.
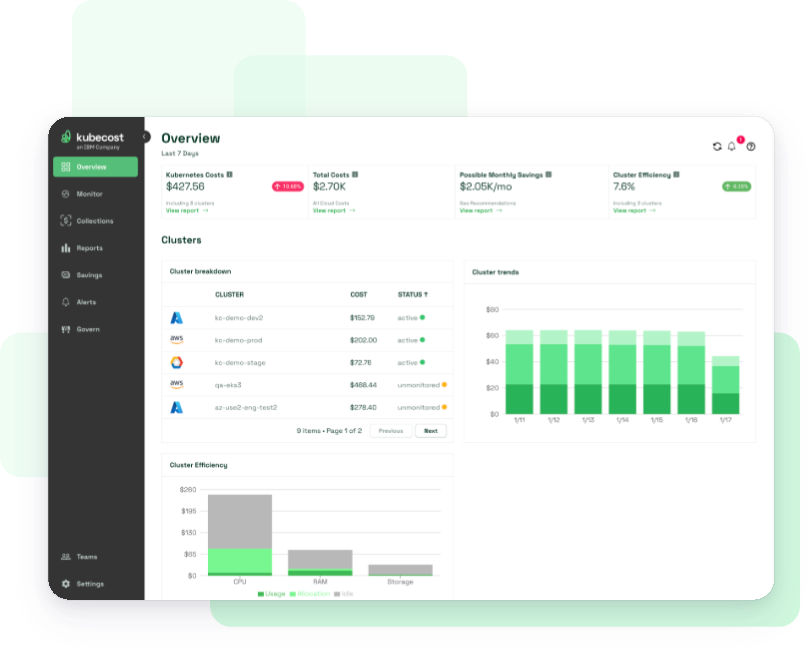
9) Kubecost (IBM)
Kubecost is a Kubernetes cost monitoring and optimization platform designed to provide real-time visibility into cloud infrastructure spending. It was first founded in 2019 by former Google engineers, it helps organizations allocate, monitor, and reduce Kubernetes-related expenses while maintaining performance. Kubecost integrates with major cloud providers (AWS, GCP, Azure) and on-premises Kubernetes environments, offering granular cost breakdowns by namespace, deployment, service, and custom labels like team or department. Kubecost is built on the open source OpenCost project.
Official URL:
Key Features and Capabilities of Kubecost:
➥ Real-time Cost Monitoring — Kubecost delivers up-to-the-minute insights into Kubernetes costs, tracking expenses tied to CPU, memory, storage, GPU, and network usage across clusters.
➥ Granular Cost Allocation — Kubecost breaks down costs by Kubernetes constructs such as namespaces, deployments, pods, labels, and services, allowing teams to pinpoint cost drivers with precision.
➥ Cloud Billing Integration — Kubecost integrates seamlessly with billing APIs from AWS, Azure, and Google Cloud, reconciling cloud provider invoices with Kubernetes resource usage for accurate cost reporting.
➥ Resource Optimization Recommendations — Kubecost analyzes cluster efficiency and provides actionable suggestions, such as right-sizing resource requests/limits, terminating idle workloads, or adjusting pod configurations to reduce waste.
➥ Multi-cluster and Multi-cloud Support — Kubecost aggregates cost data across multiple Kubernetes clusters and cloud providers, offering a unified dashboard for organizations with distributed infrastructures.
➥ Customizable Dashboards and Reporting — Users can create tailored views and export detailed reports for cost trends, forecasts, and budget tracking.
➥ Alerts and Budgeting — Kubecost supports configurable alerts for cost thresholds or anomalies and includes budgeting tools to enforce spending limits.
➥ CI/CD Pipeline Integration — Kubecost can assess the cost impact of new deployments during the CI/CD process, enabling proactive cost management before changes go live.
➥ Unified Cost Allocation — Beyond Kubernetes, it incorporates external costs (e.g., cloud storage or database services) into a single view when properly configured.
➥ Open-source Foundation — Built on OpenCost, Kubecost’s core is transparent and extensible, with community-driven enhancements available.
Pricing Details of Kubecost (as of early 2025, check website):
Kubecost offers three tiers with a 30-day free trial for all plans.
1) Foundations:
Cost: No charge
2) Enterprise Self-Hosted:
Cost: Exact pricing depends on scale (exact pricing requires consultation)
3) Enterprise Cloud:
Cost: Higher than self-hosted (exact pricing requires consultation)
Advantages of Kubecost:
- Built specifically for containerized workloads, unlike generic cloud cost tools.
- Drills down to container-level usage for precise cost attribution.
- Provides immediate visibility into cost changes enables rapid decision-making and cost control.
- Provides granular breakdowns by namespace, pod, or label.
- Optimization suggestions are clear and practical.
- Offers actionable recommendations for cost optimization.
- Community edition leverages OpenCost.
- Works with existing DevOps tools like Prometheus, Grafana, and CI/CD systems.
Limitations of Kubecost:
- Requires Kubernetes expertise for effective use.
- Limited functionality outside Kubernetes environments.
- Less effective for hybrid environments with non-containerized workloads.
- Pricing scales with core count, which can add up in large clusters.
- Costs for non-Kubernetes cloud services (e.g: S3 buckets, RDS instances) require additional configuration to integrate fully
Ideal Use Cases:
Kubecost is ideal for teams handling big Kubernetes deployments, especially those that span multiple clouds or hybrid environments. It’s perfect for companies who want to save on cloud costs without sacrificing performance.
🔮 Open Source FinOps Tools:
Now let's move on to the Open Source FinOps tools.
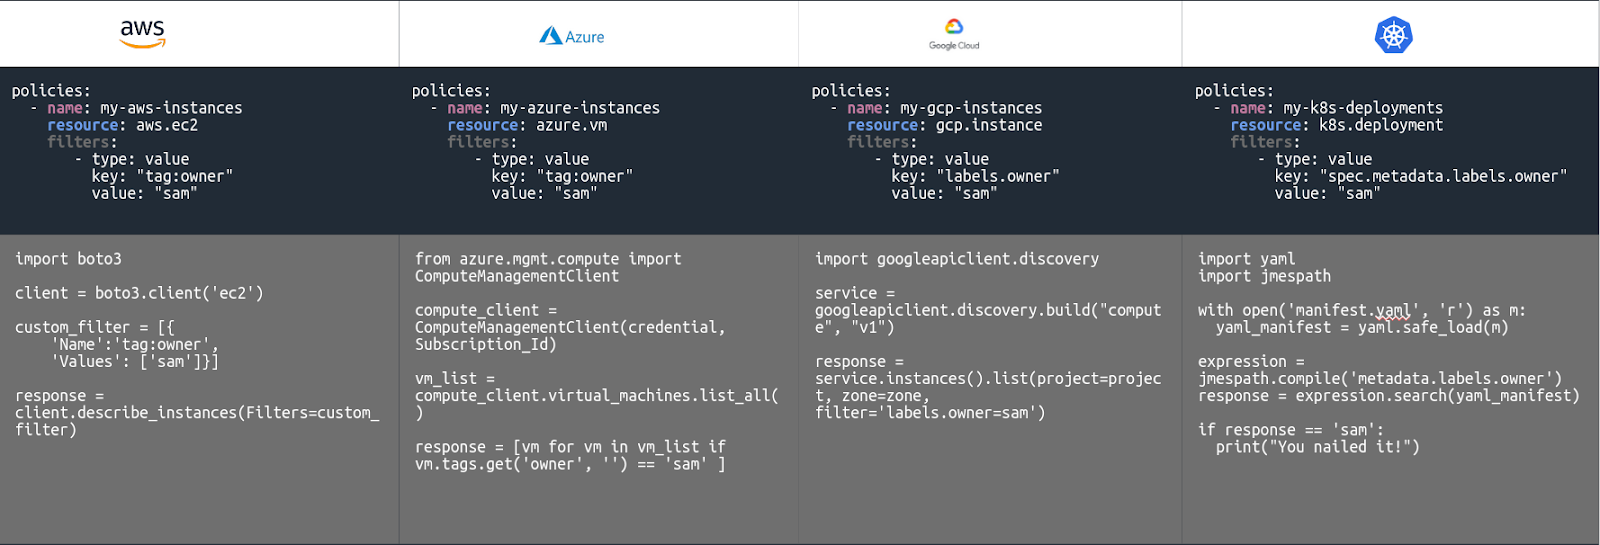
10) Cloud Custodian (c7n)
Cloud Custodian (c7n) is an open source rules engine for managing public cloud resources across AWS, Azure, and GCP. It lets you define policies in YAML to enforce compliance, security, and cost optimization through automated actions like tagging, encryption checks, or resource cleanup. Think of it as a guardrail for your cloud infrastructure—preventing misconfigurations before they become problems.
Official URL:
Site: https://cloudcustodian.io/

Key Features and Capabilities:
➥ Policy-driven automation — Write YAML policies to filter resources (e.g: unencrypted S3 buckets) and trigger actions (e.g: tag non-compliant EC2 instances or terminate them).
➥ Multi-cloud support — Manage AWS, Azure, and GCP resources with provider-native metrics and storage integration.
➥ Real-time enforcement — Deploy policies via serverless functions (AWS Lambda, Azure Functions) or run them as cron jobs.
➥ Cost Optimization — Identifies unused resources and manages off-hours to reduce expenses.
➥ Infrastructure as Code (IaC) validation — Check Terraform or CloudFormation templates for policy violations before deployment.
➥ Metrics and reporting — Output structured data to cloud-native storage (S3, Azure Blob) or monitoring services (CloudWatch, Stackdriver).
Pricing Details:
Cloud Custodian is open source and free to use. But, operational costs may arise from running it on cloud infrastructure, such as serverless functions or storage for logs.
Pros:
- Combine filters and actions to address niche compliance needs.
- No licensing fees; scales with your cloud usage
- Used in large-scale environments with thousands of resources
- Flexible and easy-to-define policies.
- Reduces manual intervention with automation.
Cons:
- Requires familiarity with YAML and cloud services.
- Limited graphical interface; primarily CLI-based.
- May need additional setup for large-scale environments.
- Policies must be updated as cloud services evolve.
Ideal Use Cases:
Cloud Custodian shines when you need granular control over multi-account cloud environments. For example, a DevOps team managing 20+ AWS accounts could use c7n to enforce encryption on all S3 buckets, auto-tag resources, or terminate idle EC2 instances. Policies run serverlessly or via CI/CD pipelines, reducing manual checks and cutting costs.
11) OpenCost
OpenCost is a vendor-neutral open source project for measuring and allocating cloud infrastructure and container costs in real time. It was built by a team of Kubernetes experts and has the support of the broader Kubernetes community. Essentially, OpenCost brings transparency to your Kubernetes spending, helping you understand exactly where your budget is going.

Official URL:
Key Features and Capabilities:
➥ Real-time cost monitoring for Kubernetes workloads, breaking down expenses by pods, namespaces, and clusters.
➥ Multi-cloud support for AWS, Azure, GCP, and on-premises clusters.
➥ API-driven integrations with tools like Prometheus and Grafana for custom dashboards.
➥ Vendor-neutral and customizable, allowing teams to extend its functionality.
➥ Cost allocation for chargeback/showback scenarios.
➥ Fully Open source and extensible to fit different FinOps needs.
Pricing Details:
OpenCost is free to use on-premises or in the cloud. Costs depend on your Prometheus/Grafana setup (managed Prometheus instances or cloud storage fees)
Pros:
- Zero licensing fees reduce upfront costs.
- Flexibility to adapt to your Kubernetes stack and reporting needs.
- Community-driven with active contributors.
- Granular visibility into Kubernetes resource usage.
Cons:
- Requires Prometheus/Grafana expertise for full utilization.
- Limited out-of-the-box dashboards compared to commercial tools like Kubecost.
- No built-in alerting or automated optimization features.
Ideal Use Cases:
OpenCost really stands out when you need clear, transparent cost tracking in Kubernetes environments. Say your team is having trouble breaking down cloud expenses by department or finding resources that aren't being used much. OpenCost gives you real-time data to make workloads more efficient and match spending to your business goals. It's especially helpful if you're already using Kubernetes and other open source tools, since it fits in perfectly with your existing observability setup.
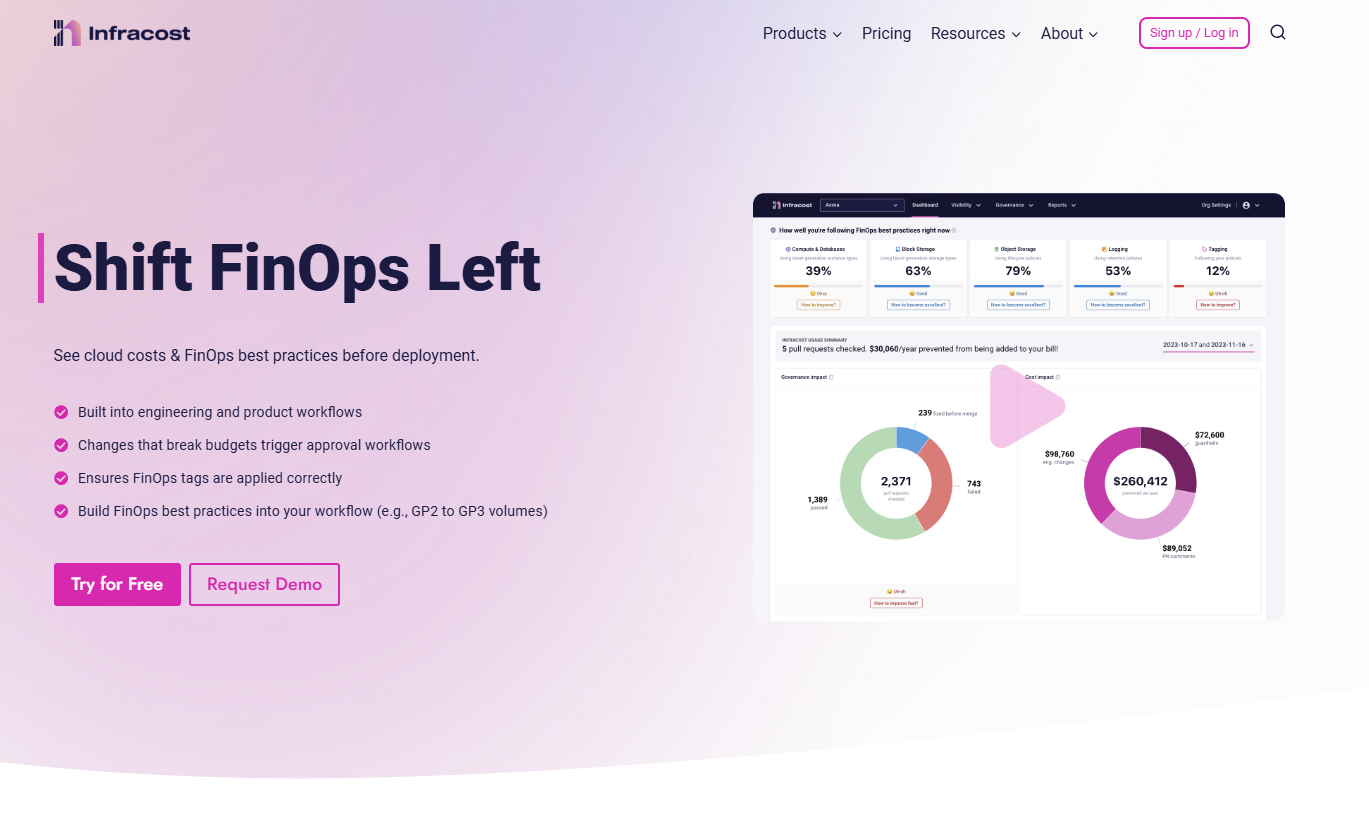
12) Infracost
Infracost is a developer-first FinOps tool that calculates cloud cost impacts before code changes hit production. It integrates directly into engineering workflows (GitHub/GitLab PRs, VSCode) to flag budget overruns, enforce tagging policies, and suggest cost-saving alternatives during code reviews.
Official URL:
Key Features and Capabilities:
➥ Cost estimation in CI/CD — Infracost automatically generates cost diffs for infrastructure changes (Terraform, Terragrunt) during pull requests.
➥ Budget guardrails — Infracost blocks merges if changes exceed predefined thresholds and triggers approval workflows.
➥ Tag compliance — Infracost enforces 100% tag coverage by scanning code for missing tags and blocking non-compliant PRs.
➥ Best practice checks — Infracost flags suboptimal configurations (e.g: GP2 vs. GP3 volumes) and suggests alternatives.
➥ Enterprise pricing support — Infracost works with custom price books, EDPs, and EAs.
➥ Multi-cloud — Infracost supports AWS, Azure, and Google Cloud.
Pricing Details:
Infracost offers three tiers:
1) Free:
CLI access and basic cost estimation.
2) Infracost Cloud:
$1,000/month for centralized policy management and Jira integration.
3) Enterprise:
Custom pricing for self-hosting, premium support, and advanced integrations.
Pros:
- Engineers see cost impacts during code reviews, not after deployment.
- Stops "tagless" resources from slipping into production.
- Centralized controls for budgets, tags, and best practices reduce manual oversight.
- Free tier and community-driven development.
Cons:
- Focuses on code changes, not retroactive cost tracking.
- Requires IaC expertise to maximize value.
- Self-hosted or advanced features may strain budgets for smaller teams.
Ideal Use Cases:
Infracost is a great fit for organizations that want to take control of their cloud costs. It integrates seamlessly into the engineering workflow, catching costly mistakes before they happen, enforcing best practices, and ensuring compliance with FinOps policies. This combination makes it super valuable for DevOps and FinOps teams trying to get the most out of their cloud spending.
13) Hystax OptScale
OptScale is also an open source FinOps and MLOps platform focused on optimizing cloud costs and resource efficiency. It helps teams manage hybrid/multi-cloud environments, reduce waste, and align spending with business goals.
Official URL:
Key Features and Capabilities:
➥ Multi-cloud cost management and optimization — OptScale tracks expenses across AWS, Azure, Google Cloud, Alibaba Cloud, and Kubernetes, with granular filtering by tags, regions, and accounts.
➥ Rightsizing engine — OptScale analyzes CPU/RAM/GPU usage to recommend optimal instance types and reserved/spot instance strategies.
➥ ML/AI optimization — OptScale profiles experiments to identify bottlenecks (e.g: idle Spark executors) and reduces costs via instance migration and cross-regional traffic analysis.
➥ FinOps enablement — OptScale implements TTL rules, budget constraints, and team-level cost accountability to build long-term cost-saving processes.
➥ Environment management — OptScale monitors IT environments, tracks software versions, and manages temporary access permissions.
Pricing Details:
OptScale is open source under Apache 2.0, free to deploy and modify. A SaaS version is available via my.optscale.com with tiered pricing for enterprise support.
Pros:
- Open source flexibility lets you tailor it to your stack.
- Shifts cost responsibility to teams using resources, fostering accountability.
- Combines cost control with performance optimization for AI workloads.
- Works across major clouds and Kubernetes.
Cons:
- Requires DevOps/cloud engineering expertise for full utilization.
- Customization needed for advanced analytics.
- Enterprise-grade assistance requires paid SaaS plans.
Ideal Use Cases:
OptScale shines for organizations with multi-cloud environments and ML/AI teams needing granular cost control. For example, a company running Kubernetes clusters on AWS and Azure could use it to rightsize GPU instances for training models while enforcing team-level budgets. Its open source nature suits startups or enterprises wanting to avoid vendor lock-in, though larger teams may need paid support for scalability.
How to Pick the Right FinOps Tools?
Choosing a tool isn't just about features; it's about fit. Here’s a practical way to think about it:
1) Know Your Environment
Single cloud? Multi-cloud? Hybrid? Using Kubernetes heavily? Data warehouses like Snowflake? Your tool must support where you run things. Don't pick an AWS-only tool if you're also on Azure.
2) What Problems Are You Solving Now?
- Just need basic visibility and reporting? Native tools might be enough.
- Struggling with cost allocation and showback? Look for strong tagging support and reporting by tag/team.
- Need to actively cut costs? Focus on tools with solid optimization recommendations (rightsizing, idle resources) and maybe automation.
- Using Kubernetes? A K8s-specific tool like Kubecost or OpenCost is probably essential.
- Need to correlate cost with performance? Look at observability-integrated tools like Datadog.
- Want developers to see costs before deployment? Infracost is the specialist.
3) Who Will Use It?
Engineers? Finance? A dedicated FinOps team? The tool needs a user interface and features tailored to its users. Engineers might want CI/CD integration, while Finance needs high-level budget reports. Is it easy enough for the intended users?
4) Integration Needs
Does it need to talk to ServiceNow? Power BI? Your CI/CD pipeline? Check the available integrations and API capabilities. Poor integration means manual workarounds.
5) Automation vs Manual
Do you want the tool to automatically terminate idle resources, or just provide recommendations for a human to act on?
6) Budget & Pricing Model
What can you afford? Understand the pricing model—it based on your cloud spend (can get expensive fast), per host, flat fee, or feature tiers? Factor in potential setup and training costs. Open source is "free" software, but requires internal time/skill (which isn't free).
7) Support & Community
How much help will you need? Check vendor support options (especially for paid tools). For open source, check the community activity (GitHub issues, forums).
8) Scalability and Future-Proofing
Will the tool grow with you? Can it handle increasing data volumes and complexity as your cloud usage expands?
Tip: Start with just one tool and see how it goes. Choose a couple that seem like a good match and do a trial run. Get feedback from the teams who'll actually be using the tool, and then make your decision from there.
Conclusion
And that’s a wrap! Cloud cost management and optimization requires practical tools that give you clear, actionable insights. FinOps tools allow you to monitor your cloud spending in real time, allocate costs to specific teams or projects, and adjust your resource usage based on data.
In this article, we have covered:
- What Are FinOps Tools?
- Benefits of Using FinOps Tools
- Comparing FinOps Tools: Native vs. Third-Party vs. Open Source
- 13 FinOps Tools & Platforms to Try in 2025
- How to Pick the Right FinOps Tool for Your Organization?
FAQs
What are FinOps tools?
FinOps tools are software solutions that collect, analyze, and report on cloud spending data. They help you track costs, allocate expenses across teams, and optimize resource usage in real time.
What does FinOps stand for?
FinOps stands for Financial Operations, a practice that combines finance, engineering, and operations to manage and reduce cloud costs.
What are the main features of FinOps tools?
Key features of FinOps tools are: real-time dashboards, cost allocation, budgeting and forecasting, anomaly detection, and automation of resource management tasks.
Are FinOps tools only for large enterprises?
No. FinOps tools are useful for organizations of all sizes, though larger setups with multi-cloud environments may benefit more from advanced third-party solutions.
Can I use native and third-party FinOps tools together?
Yes. Using a combination of native tools for basic tracking and third-party tools for advanced analytics can give you a comprehensive view of your cloud costs.
Do open source FinOps tools require coding knowledge?
Typically, yes. Open source tools such as Cloud Custodian or Kubecost may require familiarity with configuration languages (like YAML or JSON) and basic scripting skills.
How do FinOps tools help with forecasting?
These tools analyze historical usage data, apply predictive models, and generate forecasts that help you plan budgets and adjust resources based on expected future costs.
How do FinOps tools detect waste?
They monitor usage patterns to identify idle or underutilized resources and flag anomalies in spending. This data lets you adjust resource allocation to cut waste.
What are the challenges in using FinOps tools?
Challenges can include integration with existing systems, a learning curve for advanced features, and the need for customization to fit your organization’s processes.
Are open source FinOps tools suitable for large enterprises?
Many open source tools are designed for flexibility and can scale if configured properly. But, they may require more technical oversight compared to commercial products.