Poor data quality is a major obstacle for any organization that relies on data, especially those working with big data. You see problems like inaccurate reports, broken pipelines, and messed up machine learning models. Platforms like Databricks that handle massive volumes of data are especially vulnerable to issues like data drift, mismatched schemas, inconsistent data formats, redundant data, missing data, or outdated data. These problems can quickly turn a well-designed lakehouse into an unreliable data swamp. But there's good news: Databricks SQL offers a way out. It's not just a query tool—it's loaded with features to help you manage and improve data quality right within Databricks.
In this article, we will provide you with 4 concrete tips to help you proactively manage and improve data quality within your Databricks environment.
Databricks SQL: A Quick Recap
Before we jump into practical tips, let's quickly recap Databricks SQL. If you're already familiar, feel free to skim ahead.
So, what is Databricks SQL? Databricks SQL is essentially a powerful elastic query engine built for the Databricks Lakehouse. Instead of having your data in one place (a data lake) and your analytics somewhere else (a separate data warehouse), Databricks SQL lets you run fast SQL queries directly against your data lake, if that data lake is built on Delta Lake. This cuts out a lot of data movement and complexity right away.
But it's more than just a fast query engine. Databricks SQL comes tightly packed with some awesome features that directly help you manage and improve data quality. Let's look at some key features/benefits, and more importantly, how they tie into data quality:
1) Serverless and Efficient
Databricks SQL operates serverlessly. It automatically scales resources, and you’re charged only for actual usage. Why is this good for data quality? It means you can run data quality checks, monitoring jobs, and lineage queries without worrying about constantly running infrastructure.
2) Unified Data Governance (via Databricks Unity Catalog)
Databricks SQL is tightly integrated with Databricks Unity Catalog. Databricks Unity Catalog is your central control panel for all data assets in Databricks. This integration is huge for data quality because Databricks Unity Catalog lets you enforce consistent security policies, manage data access with fine-grained controls (catalogs, schemas, tables, columns, and even rows), and automatically track data lineage. Consistent governance means consistent data quality standards across your organization. You define data standards in one place and Databricks SQL helps you enforce them.
3) High Performance & Scalability
Databricks SQL is engineered for high performance. It leverages optimized engines like Photon to process large datasets rapidly. Faster query execution directly translates to quicker data quality checks. You can perform intricate data validation rules and run extensive monitoring queries against massive datasets without delays. Performance here isn't just about speed; it's about making comprehensive, frequent data quality assessments practically achievable.
4) Diverse Tool Integrations
Databricks SQL integrates with a wide range of BI tools (like Tableau, Power BI), data science tools, and other applications through standard connectors (JDBC/ODBC). This means you can build data quality dashboards, connect monitoring alerts to your existing systems, and incorporate data quality metrics into your broader data ecosystem.
For more details, refer to the Databricks SQL article.
So, why specifically Databricks SQL for data quality? It’s because Databricks SQL isn't just bolted onto a data lake; it's designed to work with the Lakehouse architecture, fundamentally built upon Delta Lake and governed by Unity Catalog. It leverages the strengths of Delta Lake's transactional guarantees, schema enforcement, data versioning, and data quality constraints and Databricks Unity Catalog's unified, governed, and reliable environment for your data.
Save up to 50% on your Databricks spend in a few minutes!

Now that you have a better picture of what Databricks SQL brings, let’s get to those four practical tips you can actually use to improve your data quality.
4 Databricks SQL Tips to Improve Databricks Data Quality
Let's start with detailed tips on how to improve Databricks data quality. We will explore 4 different techniques:
- Tip 1—Implement SQL Constraints for Data Integrity
- Tip 2—Monitor Data Quality with Lakehouse Monitoring and SQL Alerts
- Tip 3—Schema Enforcement & Controlled Evolution
- Tip 4—Trace Data Lineage for Root-Cause Analysis
Let’s dive right into it!
Note: The following tips are not limited solely to Databricks SQL. Many of these tips—such as enforcing constraints, managing schema evolution, and tracking data lineage—are also applicable to other Databricks components. You can use these best practices throughout your data ecosystem for better data quality and control.🔮 Tip 1— Implement SQL Constraints for Data Integrity
Just think about what happens when invalid data sneaks into your Delta tables. It's like a small crack in a critical structure—seemingly minor initially, but capable of causing significant issues later. Without proper data integrity checks, you risk corrupting your datasets, which can lead to inaccurate reporting, flawed ML outputs, and ultimately, misguided business strategies.
The solution? Implement SQL constraints.
What Are SQL Constraints?
SQL constraints are rules that you define on your Delta tables to reject invalid data. They operate at the row level, meaning each record is checked before insertion or update. You can add constraints such as NOT NULL and CHECK directly into your table definitions.
How to Implement SQL Constraints?
You define constraints directly in your SQL CREATE TABLE or ALTER TABLE statements when working with Delta tables. It's standard SQL, so if you've worked with databases before, this will feel familiar.
For example, adding a NOT NULL constraint on a critical column stops any insertion that doesn’t meet that rule. Similarly, a CHECK constraint can verify that a numeric value falls within an expected range.
Suppose you have a cust_orders Delta table and you need to confirm:
order_idis never missing (NOT NULL).order_totalis always positive (CHECK constraint).
Here’s how you'd create the table with these constraints:
CREATE TABLE IF NOT EXISTS cust_orders (
    order_id STRING NOT NULL,
    customer_id STRING NOT NULL,
    order_date TIMESTAMP,
    order_total DOUBLE CHECK (order_amount > 0)
)
USING DELTA
...
In this snippet, every record must include an order ID and a customer ID. The CHECK constraint stops any record with a nonpositive order_total from being written.
If you need to add a constraint later, use ALTER TABLE:
ALTER TABLE cust_orders
ADD CONSTRAINT order_amount_positive CHECK (order_amount > 0)
And to mark a column as non-nullable on an existing table:
ALTER TABLE cust_orders
ALTER COLUMN order_id SET NOT NULL;
When to Apply SQL Constraints?
Apply SQL constraints before you run heavy data ingestion jobs. Doing so stops faulty data from propagating through your system, saving you time on error handling later. If you’re ingesting data from multiple sources, add constraints to catch differences in data formats or unexpected null values.
Best Practices for SQL Constraints:
➥ Define constraints when you initially create your tables. Applying constraints after you’ve loaded a lot of potentially bad data is less effective.
➥ Record each constraint and its intended function. This practice aids in troubleshooting when issues arise.
➥ Test constraints in a lower environment. Simulate different data inputs to see if your rules catch errors as expected.
➥ When using streaming ingestion, combine constraints with periodic batch checks, as real-time enforcement may have limitations.
🔮 Tip 2—Data Quality Monitoring with Lakehouse Monitoring & SQL Alerts
Constraints are excellent for upfront data validation, but what about data quality issues that emerge after data is in your lakehouse? Data can degrade over time for many reasons, including upstream system changes, pipeline errors, or natural data evolution. Waiting for problems to show up isn’t a good strategy—you need to watch your data continuously.
Data Quality Monitoring via Lakehouse Monitoring:
Databricks Lakehouse Monitoring is designed to continuously assess the health of your data within Unity Catalog-managed tables. If you're using Databricks Unity Catalog (and you likely should be for serious data governance), Lakehouse Monitoring becomes a powerful ally. It automatically generates metrics and profiles for your tables, giving you a clear view of your data's characteristics and how they change over time.
You can activate Lakehouse Monitoring through the Databricks UI or programmatically via the API. The system automatically generates two tables and a dashboard.
- Profile Metrics Table: Stores summary statistics such as column averages, counts, and distributions.
- Drift Metrics Table: Captures changes in these statistics over time to spot shifts in your data.
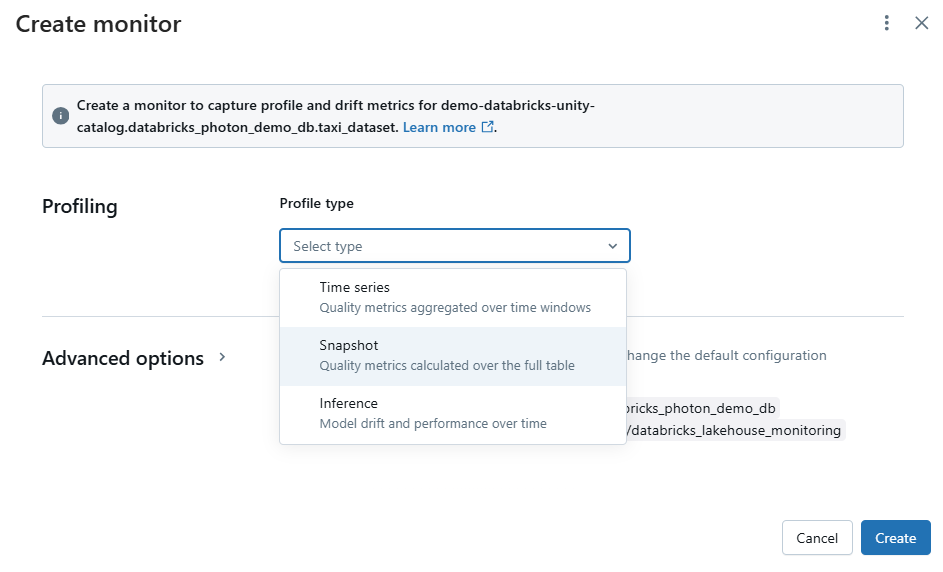
Lakehouse Monitoring offers different types of profiles depending on your data:
- Time Series Profile—For tables that have a time component. This profile breaks data into time windows and calculates metrics per window.
- Snapshot Profile—For any table managed by Delta or an external table. It captures the state of your data at a specific point.
- Inference Profile—Specifically for tables with machine learning predictions. This profile records model outputs along with related metadata like observation IDs and timestamps.
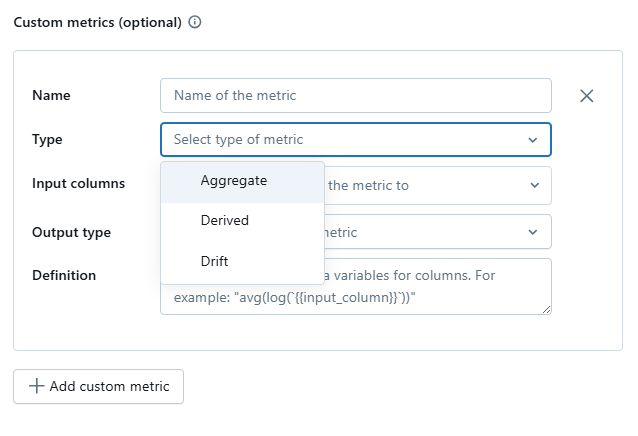
Lakehouse Monitoring also lets you define custom metrics. These custom metrics come in three forms:
- Aggregate Metrics: Calculated directly from columns in your primary table.
- Derived Metrics: Computed from aggregate metrics rather than raw data.
- Drift Metrics: Compare aggregate or derived metrics over different time windows or between primary and baseline tables.
If you manage many tables, you can use the API to set up monitoring quickly across your workspace. This approach saves time and keeps your monitoring consistent across all your data sources.
Where do you find these metrics? They are stored as Delta tables themselves. You can find these metrics in Databricks Unity Catalog under the system.information_schema catalog. The key tables are usually named something like:
<your_table_name>_profile_metrics(for profile metrics)<your_table_name>_drift_metrics(for drift metrics)
Configuring Databricks SQL Alerts
Having quality metrics is only part of the solution—you need to act when they show a problem. This is where Databricks SQL Alerts come in. Databricks SQL alerts let you write queries that track your key metrics and trigger notifications if values exceed predefined thresholds. You take an active role in monitoring your data quality by linking these alerts to your preferred notification channels.
Setting up Databricks SQL Alerts for Data Quality:
1) Create a Query
Write a query that calculates a key metric. For example, you might count records in your orders table that lack expected values.
SELECT COUNT(*) AS null_count
FROM orders_profile_metrics
WHERE order_total IS NULL;
2) Set a Threshold
Determine what constitutes an anomaly for your metric. If you expect zero nulls in the order_total field, even one null might warrant an alert.
3) Configure the Alert
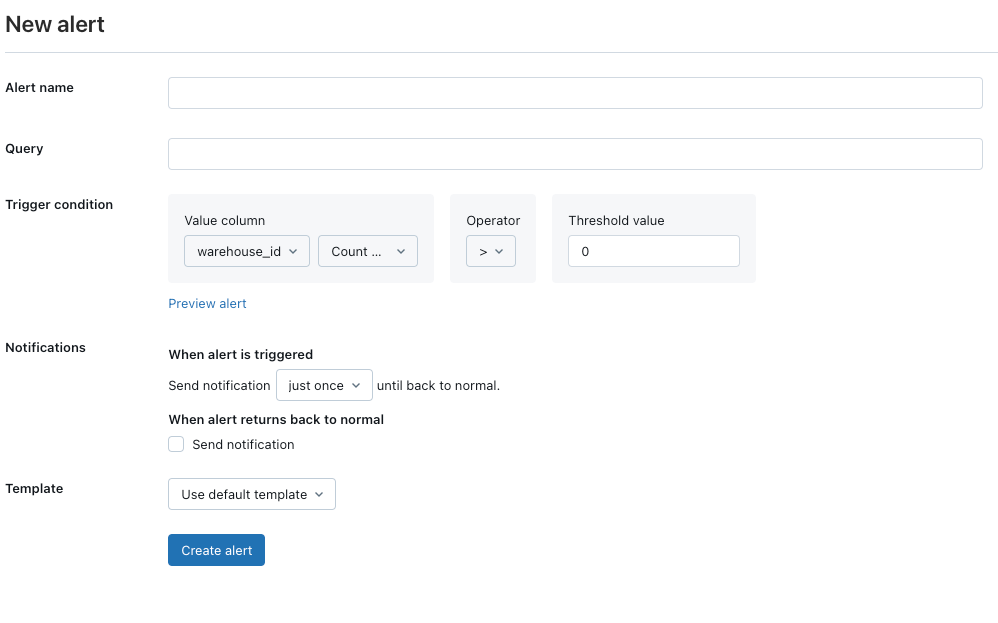
In the Databricks SQL UI:
- Name the Alert: Give your alert a descriptive name.
- Set the Condition: Use the query you created. Specify the column to check (null_count), an operator (
>,<,=, etc.), and the threshold value (e.g.,>0). - Choose Notification Destinations: Select where you want to receive notifications. You need to configure these destinations in your Databricks workspace settings first.
- Customize Notification Template: You can use a default template or create a custom one to include specific details from your query result.
🔮 Tip 3—Schema Enforcement & Controlled Evolution
Let’s imagine you are building a house with carefully designed blueprints, and then, halfway through, the construction crew starts adding rooms and changing walls without telling you. Data pipelines without schema management can feel a bit like that. Data sources evolve, business needs change, and suddenly, your carefully structured Delta tables are facing incoming data that doesn’t quite fit. Without schema enforcement, you risk data corruption and pipelines breaking. But being too rigid isn't the answer either. You need a way to adapt to change but in a controlled, quality-minded way.
Here is the solution: Delta Lake in Databricks SQL gives you schema enforcement by default, acting as a strong gatekeeper for your data structure. And when schema changes are needed, it provides "schema evolution" to let you adapt, but still maintain order.
Schema Enforcement in Delta Lake
Schema enforcement ( aka Schema validation) is a built-in data quality safeguard in Delta Lake. It makes sure that any data written to a Delta table actually fits the schema you've defined. It's like having an automatic type checker for your data.
Here is how Schema Enforcement works. When you try to write data into a Delta table, Delta Lake immediately jumps into action to validate the schema:
1) Schema Validation on Write: Before any data gets written, Delta Lake compares the schema of the data you're trying to write (usually from a DataFrame) against the schema of the target Delta table. It's a pre-write check.
2) Mismatch? Transaction Canceled: If there’s a mismatch—say, extra columns in the incoming data, or incompatible data types—Delta Lake stops the write operation cold. The transaction is canceled, no data is written, and you get an error message. This "fail-fast" approach is key to preventing bad data from sneaking in.
3) Column Compatibility is Key: Schema enforcement is primarily about column names and data types. Here's what Delta Lake checks for column compatibility:
4) No Extra Columns: The DataFrame you're writing cannot have columns that aren't already defined in the target Delta table's schema. If you try to write extra columns, it's considered a schema mismatch and will be rejected (unless you use schema evolution, which we'll get to).
5) Data Type Matching: The data types of the columns in your DataFrame must be compatible with the data types in the Delta table. Databricks tries to do safe type casting automatically where it makes sense. For example, if your table has a bigint column and you write an integer, Databricks will likely cast the integer to bigint automatically. But, it won’t do unsafe casts—like trying to force a string that isn't a number into an integer column. If a safe cast isn't possible, it's a schema mismatch.
6) Case Sensitivity (Nuances): Delta Lake stores schema information in a way that preserves the case of column names (e.g., OrderID vs orderid). But, when it comes to schema enforcement and querying, Delta Lake treats schemas as case-insensitive. This means you can query a column named OrderID using orderid, ORDERID, or OrderID – SQL will recognize them as the same. But, here's a crucial point: you cannot have two columns in the same table whose names only differ by case (like OrderID and orderid). Delta Lake will raise an error and prevent you from creating such a table. This case-insensitive handling is mostly about query convenience, not about allowing ambiguous column names.
This strict check stops any record that doesn’t match your planned schema from entering your table.
Controlled Schema Evolution
There are times when you need to modify your schema—say, to add a new column for additional information. Instead of breaking your table, Delta Lake lets you evolve your schema in a controlled way. You do this by adding the option mergeSchema when writing your data:
df.write.format("delta") \
  .option("mergeSchema", "true") \
  .mode("append") \
  .save("/delta/cust_orders");
In SQL, you might use a CREATE TABLE AS SELECT (CTAS) statement with the merge schema option.
Best Practices to Minimize Disruptions
Here are a few practices that work well when managing schema enforcement and evolution:
➥ Test schema changes in a lower or testing environment before deploying them to production.
➥ Maintain a detailed log of all schema modifications.
➥ For minor schema adjustments, use the mergeSchema option. Always verify that new columns are added correctly without impacting existing data.
➥ If Delta Lake cancels a write operation, review the error message and adjust your data or schema accordingly.
➥ Although Delta Lake attempts to cast data types, carefully plan your schema to ensure that casting occurs as expected. Mismatches can result in unexpected data behavior.
Using schema enforcement with controlled evolution lets you maintain a clean table structure while adapting to changing data needs. You block unexpected data and accept only planned modifications, keeping your data quality high.
🔮 Tip 4—Trace Data Lineage for Root-Cause Analysis
Data quality issues aren’t always immediately obvious. You might notice an incorrect number in a report or a strange anomaly in your data analysis. But where did that issue originate? Tracing back through complex data pipelines to find the root cause can be time-consuming and difficult without proper data lineage tracking. Without lineage, diagnosing data quality problems is like searching for a needle in a haystack.
Databricks Unity Catalog provides detailed, column-level data lineage. This lets you trace the journey of your data—from its sources, through various transformations, to its final destinations. Using this lineage information is crucial for rapid root-cause analysis when data quality issues arise.
Data lineage 101
Data lineage is essentially a map of your data's journey. It shows where data comes from, how it's transformed, and where it ends up. For data quality, lineage is invaluable because it allows you to:
- Understand the original sources of your data. Is it coming from internal systems, external APIs, or files?
- See every step of data processing. What transformations were applied? Which jobs or queries modified the data?
- Visualize how data moves through your pipelines and the dependencies between datasets.
When you detect a data quality issue, lineage helps you quickly pinpoint the source of the problem, whether it's a faulty transformation, an issue in the source data, or a pipeline error. It also helps you understand the downstream consequences of data quality issues or changes in your data pipelines. If a data quality problem is detected in one table, lineage helps you determine which reports, dashboards, or downstream applications might be affected.
Lineage is also important for data governance and compliance. It provides an audit trail of data origins and transformations, which is essential for regulatory requirements and data provenance.
How Databricks Unity Catalog Tracks Data Lineage
Here’s what makes Databricks Unity Catalog’s lineage truly stand out: it captures lineage at the column level. It’s not just table-to-table lineage; it's column-to-column. Why does this matter?
Imagine a report where only one column is showing incorrect data. With table-level lineage, you might see that the report table depends on a few upstream tables. But with column-level lineage, you can pinpoint exactly which column(s) in the upstream tables contributed to that specific problematic column in the report.
You can access lineage information in a few ways:
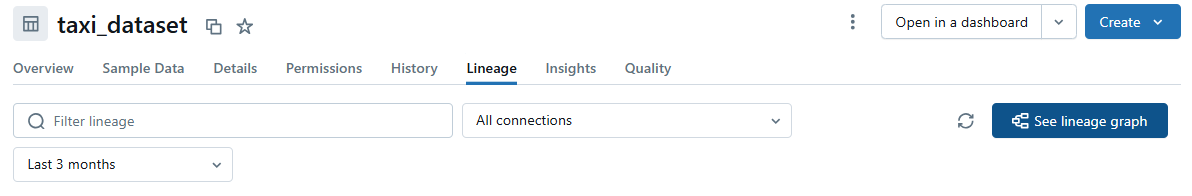
1) Databricks UI - Unity Catalog Explorer
Databricks Unity Catalog Explorer in the Databricks UI provides a visual interface to explore lineage. Navigate to any table managed by Unity Catalog, and you'll find a "Lineage" tab. This tab displays a visual graph showing the table's upstream sources (upstream lineage) and downstream dependencies (downstream lineage). You can click on nodes in the graph to explore lineage further, and crucially, you can see column-level lineage by selecting a specific column in a table.
2) Unity Catalog System Tables (Programmatic Lineage with SQL)
Databricks Unity Catalog exposes lineage information through system tables in the system.access catalog (e.g., system.access.column_lineage, system.access.table_lineage). You can query these tables using SQL to programmatically retrieve lineage metadata. This is useful:
- If you want to write SQL scripts to automatically retrieve lineage information for specific tables or columns.
- To display lineage information alongside data quality metrics in dashboards.
- To incorporate lineage into broader data governance workflows and tools.
3) Databricks REST API (Integration with External Systems)
For even deeper integration, Databricks provides REST APIs to access Unity Catalog metadata, including lineage. This API access lets you connect lineage information to external data catalogs, data governance platforms, or build custom lineage visualization tools outside of the Databricks UI.
Benefits:
➥ Data lineage provides a clear and auditable trail of data transformations, increasing trust in your data assets.
➥ Data lineage significantly reduces the time required for root-cause analysis of data quality issues.
➥ Data lineage supports data governance initiatives by providing data provenance and auditability.
Limitations:
➥ Data lineage in Databricks SQL is primarily powered by Databricks Unity Catalog. To get the full benefits of lineage, your data and pipelines should be managed within Unity Catalog. Lineage for tables outside of Unity Catalog may be limited.
➥ Lineage for external tables (tables pointing to data outside of Databricks Unity Catalog's managed storage) can be less comprehensive than for managed tables. Lineage tracking is most complete when data is fully governed by Unity Catalog.
Want to take Chaos Genius for a spin?
It takes less than 5 minutes.

Conclusion
And that’s a wrap. The four tips—implementing SQL constraints, monitoring with Databricks Lakehouse Monitoring and Databricks SQL Alerts, enforcing and evolving schemas, and tracing data lineage—form an integrated approach to managing data quality in Databricks. Together, they help you move from reactive troubleshooting to proactive quality management. Always test changes in a controlled environment, document modifications, and pair automated alerts with regular manual reviews to maintain the highest data quality standards.
In this article, we have covered:
- 4 Databricks SQL Tips to Improve Data Quality:
… and more!
FAQs
What is Databricks SQL?
Simply put, Databricks SQL is a serverless data warehouse inside your Databricks lakehouse. It's a query engine optimized for running fast SQL queries directly on your Delta Lake data. Think of it as the analytics layer built right into your data lake. Instead of moving data to a separate warehouse for SQL analytics, you query it directly where it lives.
What role do SQL constraints play?
SQL constraints enforce data integrity at the row level by rejecting data that violates defined rules (e.g., NOT NULL, CHECK). They act as preventative measures against invalid data during ingestion and updates.
How does Lakehouse Monitoring integrate with SQL for data quality?
Lakehouse Monitoring automatically crunches metrics about your Delta tables (completeness, distribution, etc.) and stores these metrics as… you guessed it… Delta tables! Because these metrics are in tables, you can query them and monitor data quality trends.
Does Lakehouse Monitoring support custom metrics?
Yes, Lakehouse Monitoring supports custom metrics, including aggregate, derived, and drift metrics. This allows you to track business-specific data quality indicators beyond the built-in metrics.
When and how should schema evolution be applied in Databricks?
Schema evolution (mergeSchema) is beneficial when you anticipate schema changes in data sources, such as adding new columns. Use it cautiously, primarily for adding columns in agile or exploratory pipelines. Avoid relying on it for production systems with strict schema contracts, where explicit schema migrations are preferable.
Can SQL alerts be used to automate data quality monitoring in Databricks?
Yes, SQL Alerts are designed for automated monitoring. Define a SQL query that checks data quality metrics, set a schedule, and configure alert conditions. Databricks SQL will automatically run the query and send notifications when conditions are met, enabling automated data quality monitoring.
How does Unity Catalog support data lineage?
Databricks Unity Catalog captures detailed, column-level lineage across your pipelines. You can view lineage via the Databricks UI, query system tables, or use REST APIs. This detailed tracking helps you perform root-cause analysis quickly when data quality issues arise.